

4 min read
New customer costs fell $55. Meta missed it.
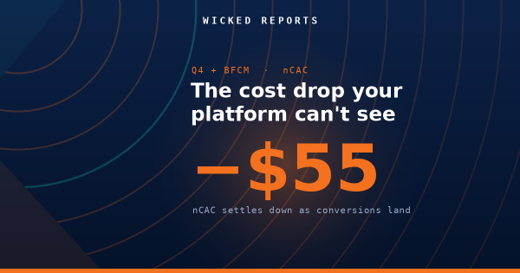
How much does new customer CAC fall after the click month?
New customer acquisition cost is supposed to be a number you can trust on the day you read it. In Q4 it is not, and the size of the gap is the whole story.
Topics: Wicked Reports New Customer Acquisition Cost (NCAC) blended ROAS BFCM Delayed Conversions Meta CAC BFCM
4 min read
The sooner you buy Meta clicks, the more you make
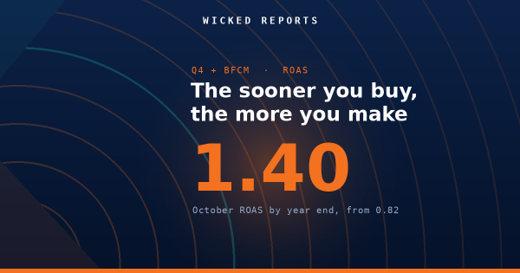
When is the best time to buy Meta clicks in Q4?
If there is one line to plan Q4 around, it is this : the sooner you buy the click, the more money it makes by the time the year closes.
Topics: Wicked Reports meta roas BFCM BFCM ROAS When To Buy Meta Clicks
3 min read
Is the 49% BFCM click premium worth it?
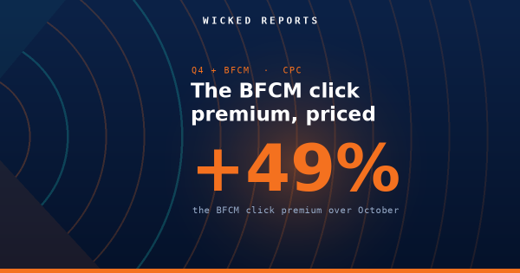
How much more do Meta clicks cost on BFCM?
Every Q4 you watch your Meta cost per click climb, and every Q4 you wonder whether the BFCM premium is worth paying. Here is the 2025 answer, with the numbers.
Topics: Wicked Reports BFCM BFCM CPC Meta CPC BFCM Ad Premium CPC vs CAC
10 min read
The Paid Traffic Truth : Paid Traffic Enters Q4 Cheaper Than It Left August
The Paid Traffic Truth — Issue 015
Published October 05,2026 * Data for the week of September 27 to October 03 2026 * Aggregated across hundreds of Wicked Reports accounts.
Paid Traffic Enters Q4 Cheaper Than It Left August
September threw a holiday spike, a month-long Meta slide, and a YouTube reset at the market. Now the month is closed and the noise has washed out, and the net result is simple: the two channels carrying 92% of tracked spend enter Q4 at or below where they ended August. These are the baseline numbers to judge the Q4 ramp against, and the ramp is the next thing coming.
This week's number
The September round trip is complete. Meta enters October at $76, 11% cheaper than late August. Google enters at $160, flat to where it started, with the holiday spike fully unwound.
01 / Introduction
The month closed. Here is where it left you.
This is the first issue of October, so before the weekly grids, this one does something the series has not done before: it closes out a full month. Five weeks of verified data covered the Labor Day run-up, the holiday itself, two clean recovery weeks, and now the first week of Q4 proper. Every one of those weeks moved some channel around. The question that matters for planning is what survived the round trip.
The answer is below, followed by the same four verified grids as every week: new customer acquisition, first click versus last click, overall channel performance, and new customer lifetime value. All first-party, order-verified data aggregated across hundreds of Wicked Reports accounts. No modeling, no surveys.
02 / Analysis
One chart, the whole month
Here is September in a single picture: verified nCAC for the two largest channels, all five weeks.
Two stories ran through September, and they ended differently. Google's story was the holiday: Labor Day pushed its new customer cost from $161 to $179, and three consecutive declining weeks brought it back to $160, with conversion up 3% this week. A complete round trip. If you panicked about Google in mid September or celebrated it this week, you were reacting to the calendar both times.
Meta's story was not the holiday, and that is the part worth carrying into Q4. Its decline ran through the holiday weeks and the clean weeks alike, $85 to $74 over four weeks, before ticking up 2% to $76 this week on softer conversion. One week is a data point, not a reversal, so the honest read is that the slide has stopped and the channel has settled at a level about 11% below late August. The quality held the entire time: 91% of Meta's tracked customers are verified first-time buyers, same as every week this month, with the markup over blended CAC now at 9%. The cause of the slide is still what it was last week, a mix story rather than cheaper auctions, and still unproven. The level itself is verified either way.
Why this matters right now: the Q4 ramp is the next structural event on the calendar. As BFCM spend floods the auctions over the coming weeks, costs will climb, and every brand will face the same question at every weekly check-in: is this seasonal inflation I planned for, or is my account deteriorating? You cannot answer that without knowing precisely where you started. This month-end snapshot is the market's starting line. Yours is in your own account.
03 / New Customer Acquisition
The full acquisition picture, by channel
Beyond the two headliners: Microsoft drifted up again to $191 and has now round-tripped the holiday in the wrong direction, the one major channel entering October more expensive than it entered September. YouTube settled a second week in the low $400s, still well below its August range, with a soft conversion week. TikTok collapsed back to thin-data status with a new-buyer share that fell to 51%, its fourth violent swing in four weeks, which is exactly why thin channels never anchor a conclusion here.
04 / First Click vs Last Click
Who starts the sale vs who takes the bow
This grid is a measurement reconciliation, not an investment case. It explains why the platforms' own dashboards disagreed with the verified numbers all month: last click shifts credit from the channels that open journeys toward the channels that close them, so a last-click view understated Meta's September and flattered the search channels. When you compare your Q4 numbers against a baseline, make sure both were measured under the same model, or the comparison is meaningless before you start.
05 / Overall Channel Performance
Where the money goes, and THE TRUE COST OF A NEW CUSTOMER
The standing pattern survives the month-end accounting intact. Google's ROAS is 2.7x Meta's, and a new customer still costs 111% more there, because its 54% markup between blended CAC and true new customer cost is repeat demand doing the flattering. Meta's 9% markup is the tightest in the grid. Whatever the Q4 auctions do to these numbers, the ROAS column will keep ranking the channels in the wrong order for growth, and that does not change with the season.
06 / New Customer Lifetime Value
What a new customer becomes over a year
The value side barely moved all month, which is the point of this grid. Acquisition costs swung with the calendar while what a new customer becomes stayed steady: Meta's one-year value sat within a few dollars of $108 every week, Google's near $243. That stability is what makes the cost side plannable. Your Q4 question is not whether customers will be worth less, it is what you will pay to get them. The standing caveat applies: this grid blends brands at very different price points, so treat it as a directional market benchmark, not a promise for any one store.
07 / Conclusion
Write down your starting line this week
The market enters Q4 with Meta around $76 and 11% cheaper than late August, Google flat at $160, Microsoft slightly elevated, and YouTube settled well below its summer range. Clean entry conditions, about eight weeks out from BFCM, with the spend ramp ahead of it.
The move this week takes twenty minutes. Pull your own verified September numbers per channel, nCAC and new-buyer share, and write them down as your Q4 baseline before October data starts piling on top of them. Then judge every week of the ramp against that line. When your Meta nCAC reads 30% higher in early November, the baseline is what tells you whether that is the seasonal inflation everyone pays or a problem that is yours alone. Brands that skip this step spend November arguing about numbers nobody wrote down in October.
See your own version of these four grids.
Your real nCAC next to your aCAC, your first versus last click gap, your new customer LTV by channel, in your own account.
Get the Paid Traffic Truth Report directly to your inbox.
How this week's numbers were built. Aggregated across hundreds of Wicked Reports client accounts for the week of September 27 to October 03, 2026, except first click vs last click, which uses a rolling 90 day window. New versus repeat is verified at the order level against first party order IDs, not modeled and not surveyed. The new visit to new customer conversion rate credits the channel that originated the new visit. Channels without cost data, including email, SMS, organic, and influencer, are left out of the cost comparisons. Snapchat is excluded for negligible spend. Pinterest is marked with an asterisk because it ran on a small number of new customers this week, so it is not used to anchor any headline. The channel labeled Facebook in the underlying platform data is shown here as Meta. Charts and tables carry meaning through direction, labels, and contrast rather than color alone.
Topics: Wicked Reports New Customer Acquisition Cost (NCAC) Meta Ads Paid Traffic Truth paid media measurement BFCM Q4 Budget Planning
3 min read
The $55 nCAC drop Meta never showed you
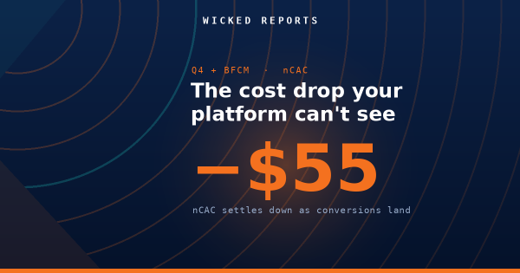
New customer acquisition cost is supposed to be a number you can trust the day you read it. In Q4 it is not, and the size of the gap is the whole story.
Topics: Wicked Reports New Customer Acquisition Cost (NCAC) blended ROAS BFCM Delayed Conversions Meta CAC BFCM
4 min read
Why Meta customers gain $112 after the click
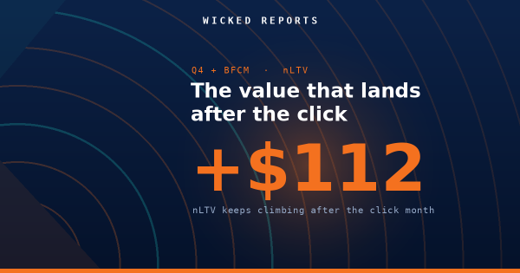
How much new customer value lands after the click month?
If you graded your October Meta spend on the numbers your ad platform showed you in October, you graded it months too early.
Topics: Wicked Reports BFCM nLTV Cohort New Customer LTV Meta Attribution Lag Click Level Attribution
10 min read
The Paid Traffic Truth : Why Meta's New Customer Cost Fell Four Weeks Straight
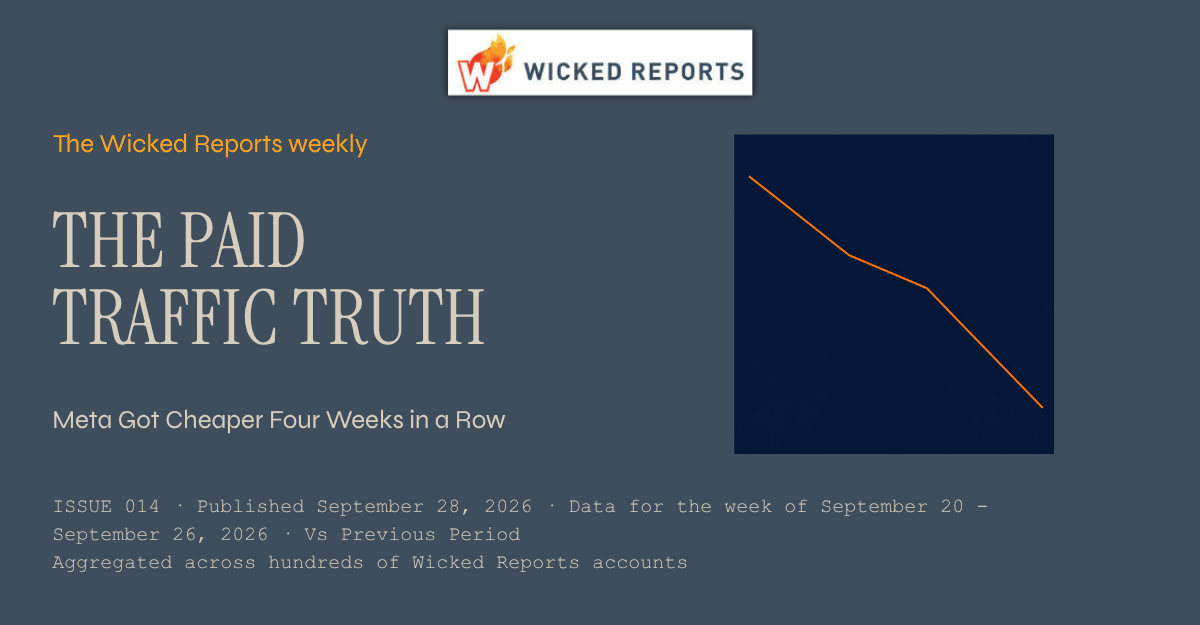
The Paid Traffic Truth — Issue 014
Published September 28,2026 * Data for the week of September 20 to September 26 2026 * Aggregated across hundreds of Wicked Reports accounts.
Meta Got Cheaper Four Weeks in a Row
September's noise was the holiday. September's signal was Meta. While the other channels bounced around Labor Day and back, the verified cost of a new customer on Meta fell every single week of the month, and it is doing it with the highest share of genuinely new buyers of any channel. If you are setting Q4 budgets on last quarter's Meta numbers, they are already stale.
This week's number
Meta's verified nCAC fell a fourth consecutive week to $74, down from $85 a month ago, a 13% decline at a steady 91% new-buyer share.
01 / Introduction
The quietest trend of the month is the biggest one
For three issues running, Meta's falling new customer cost has been a side note while louder stories took the headline. It has now earned the headline. Four weeks, four declines: $85, $82, $78, $74. On the channel carrying half of all tracked spend in this data set, that is not a footnote. That is the market moving.
This issue looks at what is behind the run and what it should change about Q4 planning, then walks the same four verified grids as every week: new customer acquisition, first click versus last click, overall channel performance, and new customer lifetime value. All first-party, order-verified data aggregated across hundreds of Wicked Reports accounts. No modeling, no surveys.
02 / Analysis
Four weeks down, and the new-buyer share never budged
A falling acquisition cost is only good news if the customers are real. The first thing I checked across all four weeks is the quality of what Meta is delivering, and it held. The share of Meta's tracked customers who are verified first-time buyers stayed at 90% to 91% the entire month, the highest of any channel, and the markup between blended CAC and true new customer cost stayed pinned at 10% to 11%. The decline is not repeat buyers sneaking into the mix and dragging the average down. Meta is buying genuinely new customers, and the price keeps dropping.
The holiday question is the obvious objection, and the chart answers it. The first two declines happened during the Labor Day run-up and the holiday week itself, when discovery channels always get a temporary discount, and I said at the time not to treat that cheapness as a baseline. But the holiday unwound weeks ago. Search costs snapped back. Meta kept falling anyway, through two clean weeks, which is what separates a calendar effect from a trend.
What I cannot yet give you is the cause. This week's decline came with conversion nearly flat and click prices nearly flat, so the drop is not better auction prices and not better site conversion. That points to mix: which accounts, campaigns, and products the spend is flowing through. One candidate worth naming is that Meta's share of tracked spend has drifted down for three straight weeks, from 53.5% to 50.1%, and when marginal dollars leave a channel, the budget that remains tends to be concentrated in its strongest campaigns, which improves the average. That is a hypothesis, not a finding. The trend is verified. The mechanism is not, and I would rather tell you that than invent a clean story.
03 / New Customer Acquisition
The full acquisition picture, by channel
Elsewhere in the grid: Google settled a second week at $167 with conversion up 4%, so search is back to its normal shape after the holiday. YouTube gave back part of last week's big drop, landing at $430 with 76% new buyers, still well below its August range of roughly $800, and worth continued attention. Microsoft had an odd week, with conversion up 5% but click prices up 9%, pushing its nCAC to $186. TikTok whipsawed downward again and returns to thin-data status, which is why I do not trade on its weekly reads.
04 / First Click vs Last Click
Who starts the sale vs who takes the bow
The Meta row is the reason a month-long trend like this stays invisible on most dashboards. Meta is under-credited on last click, so a chunk of the new customers it keeps acquiring more cheaply gets booked to whatever search ad closed the journey. If your reporting runs on last click, your Meta improved all month and your dashboard split the credit with Google.
05 / Overall Channel Performance
Where the money goes, and THE TRUE COST OF A NEW CUSTOMER
The standing pattern holds even in Meta's best month. Google posts a ROAS of 1.32 against Meta's 0.51, and a new customer still costs 126% more on Google. The 56% markup between Google's blended CAC and its true new customer cost is repeat demand doing the flattering. Meta's 10% markup means the cheap number on its row is almost entirely new business. If Q4 budgets get set on the ROAS column, the money moves in exactly the wrong direction.
06 / New Customer Lifetime Value
What a new customer becomes over a year
The LTV grid shows why the four-week run matters more than a discount usually would. Meta has always been the thin-margin channel in this data set: a low first order that grows to $108 at one year, against an acquisition cost that used to leave little room. A month ago that spread was $111 of value against $82 of cost. This week it is $108 against $74. Same value curve, meaningfully more margin. The standing caveat applies: this grid blends brands at very different price points, so treat it as a directional market benchmark, not a promise for any one store.
07 / Conclusion
Re-pull your Meta number before you lock Q4
Black Friday budgets are being finalized right now, and most of them are being built on Meta nCAC assumptions from July or August. This data says the market's number has moved 13% in a month. If your plan still carries the old figure, your Q4 model is conservative in the one place you might not want it to be, and if you are pacing spend to a target nCAC, you may be leaving volume on the table at a price you would happily pay.
The move this week: pull your own verified Meta nCAC for September, not the platform-reported number, and check it against whatever figure is sitting in your Q4 plan. Then check your new-buyer share alongside it, because a cheap Meta number only helps if it is buying new customers rather than recycling old ones. The aggregate trend is real, but your account is not the aggregate, and the only version of this number worth planning on is your own.
See your own version of these four grids.
Your real nCAC next to your aCAC, your first versus last click gap, your new customer LTV by channel, in your own account.
Get the Paid Traffic Truth Report directly to your inbox.
How this week's numbers were built. Aggregated across hundreds of Wicked Reports client accounts for the week of September 20 to September 26, 2026, except first click vs last click, which uses a rolling 90 day window. New versus repeat is verified at the order level against first party order IDs, not modeled and not surveyed. The new visit to new customer conversion rate credits the channel that originated the new visit. Channels without cost data, including email, SMS, organic, and influencer, are left out of the cost comparisons. Snapchat is excluded for negligible spend. Pinterest is marked with an asterisk because it ran on a small number of new customers this week, so it is not used to anchor any headline. The channel labeled Facebook in the underlying platform data is shown here as Meta. Charts and tables carry meaning through direction, labels, and contrast rather than color alone.
Topics: Wicked Reports New Customer Acquisition Cost (NCAC) Meta Ads Paid Traffic Truth paid media measurement Q4 Budget Planning Verified Attribution
10 min read
The Paid Traffic Truth : Why YouTube's New Customer Cost Just Reset
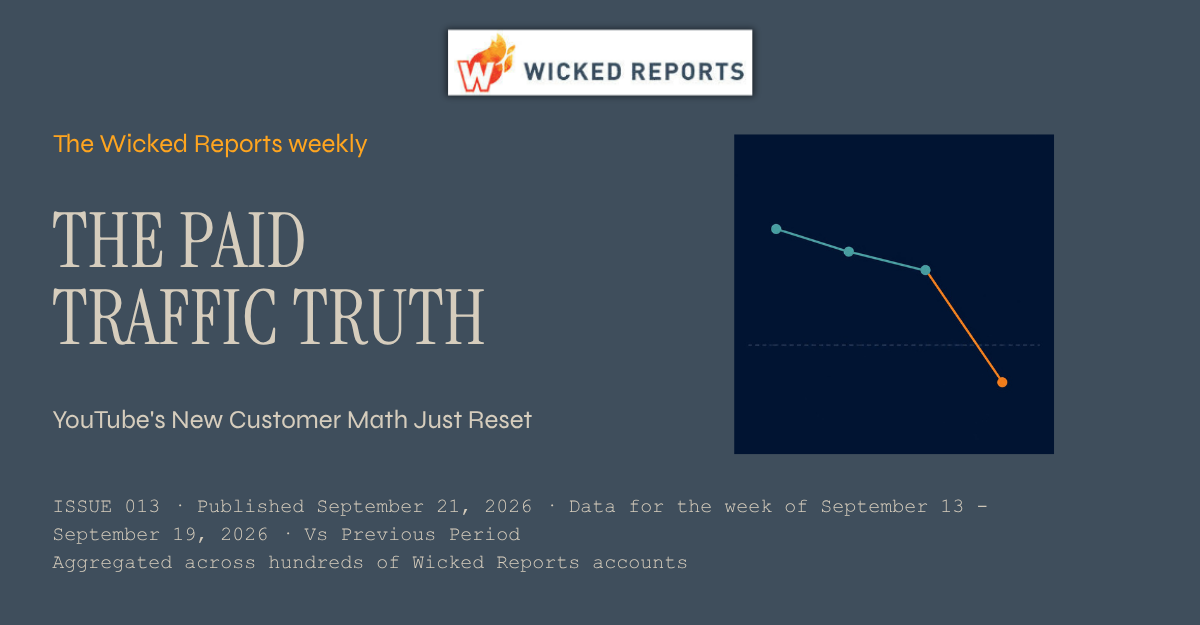
The Paid Traffic Truth — Issue 013
Published September 21,2026 * Data for the week of September 13 to September 19 2026 * Aggregated across hundreds of Wicked Reports accounts.
YouTube's New Customer Math Just Reset
Everyone spent September watching Meta and Google trade holiday effects. Meanwhile the biggest verified move of the week happened on the channel most brands wrote off as unmeasurable. YouTube's cost of a new customer fell by nearly half, and the give-back from the holiday only explains part of it.
This week's number
YouTube's verified nCAC fell 43% in one week, from $629 to $360, while new visit to customer conversion rose 54% and its new-customer share jumped from 56% to 79%.
01 / Introduction
First, the receipt. Then the actual news.
Last issue ended with a prediction: the Labor Day effect would give something back, and I would report it either way. Here is the scorecard. Search snapped back on cue, with Google's nCAC down 4% to $172 and conversion up on both Google and Microsoft. Meta, meanwhile, never gave anything back. Third straight week of falling new customer cost, now at $78. The full grids are below.
But the real story of the week is not the two channels everyone watches. It is the one most brands quietly gave up on measuring. This issue tells that story, then walks the same four verified grids as always: new customer acquisition, first click versus last click, overall channel performance, and new customer lifetime value. All first-party, order-verified, aggregated across hundreds of Wicked Reports accounts. No modeling, no surveys.
02 / Analysis
Video's quiet reset, and how much of it is real
Three YouTube numbers moved together this week, and the combination matters more than any one of them. Verified nCAC fell 43% to $360. New visit to customer conversion rose 54%. And the share of YouTube's tracked customers who are genuinely new jumped from 56% to 79%, which pulled its markup over blended CAC down from 79% to 25%. Click prices were flat. This was not YouTube getting cheaper to click. It was YouTube traffic converting better and skewing much harder toward first-time buyers.
Why does this matter beyond one channel's good week? Because YouTube is the channel where the measurement excuse runs deepest. Views happen on a TV screen, the click comes days later from a phone, last-click reporting hands the sale to search, and the line item gets cut. This week, verified at the order level, that supposedly unmeasurable channel bought a new customer for $360 while carrying the second-highest new-customer share of any paid channel at 79%, behind only Meta's 91%. Video is prospecting almost by definition, and this week the prospecting got dramatically more efficient.
The honest note, and this one needs to be firm. This is one week of data on a channel carrying 4.3% of tracked spend, so a smaller pool of accounts can move the aggregate more than it could on Meta or Google. Part of the drop is plain post-holiday normalization, because YouTube's cost inflated through the holiday weeks. But the give-back defense only stretches so far: a return to normal would land YouTube back in its pre-holiday range, and $360 is far below it, with the new-customer mix shift pointing the same direction. I am calling this a watch-list item, not a scale signal. If nCAC holds under roughly $450 next week with the new share staying near 80%, it starts to look structural. One week is never a budget decision.
03 / New Customer Acquisition
The full acquisition picture, by channel
Beyond the YouTube row, note the search recovery I promised to report: Google and Microsoft conversion both climbed as the holiday effect unwound, exactly the snap-back Issue 011 predicted. TikTok swung violently the other way, conversion up 329% and nCAC down 80% to $227, but it whipsawed just as hard downward the week before, so I treat its week-to-week reads as noise until it strings a few together. Meta keeps grinding cheaper, a story we are now watching closely into Q4.
04 / First Click vs Last Click
Who starts the sale vs who takes the bow
The YouTube row here is the reason this week's reset went unnoticed on most dashboards. Video is under-credited on last click, so the platforms handing out credit gave a piece of YouTube's improvement to the search box that closed the journey. If your reporting runs on last click, your YouTube got cheaper this week and your dashboard told you Google did it.
05 / Overall Channel Performance
Where the money goes, and THE TRUE COST OF A NEW CUSTOMER
Look at YouTube's markup column against the search channels. A week ago video carried a 79% penalty between blended CAC and true new customer cost. This week it is 25%, tighter than Google's 58% and Microsoft's 70%. Search still posts the pretty ROAS numbers, and search is still where blended CAC most flatters the real cost of growth. The standing lesson of this grid does not change: the channels that look most efficient on ROAS are the ones borrowing most heavily from demand that already existed.
06 / New Customer Lifetime Value
What a new customer becomes over a year
This grid is what turns YouTube's cheap week into a real economics question. A YouTube customer starts at $79 and nearly triples inside 30 days to $233, the steepest early payback curve of any paid channel, reaching $261 at one year. Judged on day-zero math, a $360 nCAC against a $79 first order looks indefensible. Judged on the 30-day number, the gap nearly closes on click-credited revenue alone, before any view-through contribution. The standing caveat applies: this grid blends brands at very different price points, so it is a directional market benchmark, not a promise for any one store.
07 / Conclusion
Put video on the watch list, with a number attached
The September story so far: the holiday came and went, search snapped back, Meta keeps getting quietly cheaper, and now video just posted the biggest verified efficiency move of the month while most dashboards handed the credit to the search box. None of that is visible on last click, and none of it is visible on ROAS.
The move this week is specific. Pull your own YouTube new customer cost, verified against orders, not platform-reported. Write down this week's number and the new-customer share next to it. If both hold through next week, you have an early position on a channel most of your competitors stopped measuring years ago. That is the entire advantage: not spending more, just knowing sooner. I will publish what the aggregate did either way.
See your own version of these four grids.
Your real nCAC next to your aCAC, your first versus last click gap, your new customer LTV by channel, in your own account.
Get the Paid Traffic Truth Report directly to your inbox.
How this week's numbers were built. Aggregated across hundreds of Wicked Reports client accounts for the week of September 13 to September 19, 2026, except first click vs last click, which uses a rolling 90 day window. New versus repeat is verified at the order level against first party order IDs, not modeled and not surveyed. The new visit to new customer conversion rate credits the channel that originated the new visit. Channels without cost data, including email, SMS, organic, and influencer, are left out of the cost comparisons. Snapchat is excluded for negligible spend. Pinterest is marked with an asterisk because it ran on a small number of new customers this week, so it is not used to anchor any headline. The channel labeled Facebook in the underlying platform data is shown here as Meta. Charts and tables carry meaning through direction, labels, and contrast rather than color alone.
Topics: Wicked Reports New Customer Acquisition Cost (NCAC) Paid Traffic Truth YouTube Ads Video Prospecting First Click vs Last Click Attribution
5 min read
Why Your Holiday Marketing Reports Lie to You Twice

Q4 is the season your reporting is least trustworthy and most consequential. More spend moves, faster decisions get made, and the numbers you make them on are distorted in two separate ways at once. Most teams catch neither. A few catch one. The report that catches both is the difference between a profitable holiday and a post-mortem in January.
Topics: Wicked Reports New Customer Acquisition Cost (NCAC) agency reporting black friday Wicked Reports Paid Traffic Truth Client Reporting
10 min read
The Paid Traffic Truth : Why Holiday Demand Pays Meta and Bills Google
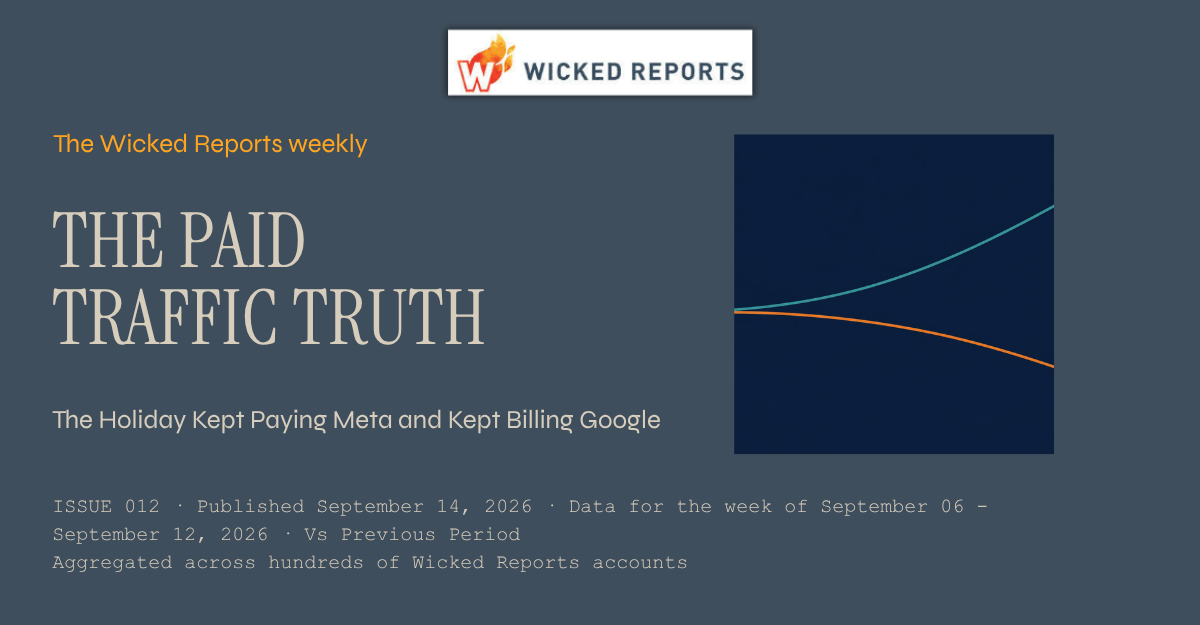
The Paid Traffic Truth — Issue 012
Published September 14,2026 * Data for the week of September 06 to September 12 2026 * Aggregated across hundreds of Wicked Reports accounts.
The Holiday Kept Paying Meta and Kept Billing Google
Last week I told you the Labor Day run-up made discovery channels cheaper and search more expensive. This week contained the holiday itself, and the split did not soften. It widened. If you run both Meta and Google, the same calendar event just moved your two biggest channels in opposite directions for the second week in a row.
This week's number
Google's verified new customer cost climbed a second straight week, up 11% to $179, while Meta's fell again to $82. Same holiday. Opposite bills.
01 / Introduction
Labor Day, part two. The split held.
In Issue 011 I flagged that the Labor Day run-up was making everyone's ads look smarter than they are, with one exception : Google, the lone major channel where the cost of a new customer went up while everything else got cheaper. I also said this week's data would contain the holiday weekend itself, so we would find out whether that was noise or a pattern.
It was a pattern. This issue tells that one story, then walks the same four verified grids we publish every week: new customer acquisition, first click versus last click, overall channel performance, and new customer lifetime value. All of it is first-party, order-verified data aggregated across hundreds of Wicked Reports accounts. No modeling, no surveys.
02 / Analysis
Holiday demand is discovery demand. Two weeks of receipts.
Here is what the week of the holiday itself did to the two channels that carry 93% of tracked spend. Meta's verified nCAC fell 4% to $82, with new visit to customer conversion up 7% and click prices down 6%. Google's nCAC rose 11% to $179, with conversion down 5% and click prices barely moving. That is the second consecutive week the two lines have moved apart.
The mechanism is the one I named last week, now with confirmation. A holiday puts people in browse mode. Feeds fill with deal creative and shoppers buy things they were not searching for, which is why Meta converted better and got cheaper. Search works the opposite way. Holiday buyers who would have typed a brand name into Google got intercepted upstream by a feed ad, so search traffic skewed toward comparison shoppers and its conversion slipped. Microsoft, the other search channel in the set, told the same story louder: conversion down 13% and nCAC up 26% to $171. When both search channels move together against both discovery patterns, that is not one platform having a bad week. That is demand changing shape.
The honest note. This is still a calendar story, not a structural one. Two weeks of divergence is a holiday arc playing out exactly as a holiday arc should: the run-up week, then the holiday week itself. The structural part is the lesson, not the numbers. Holiday demand reliably flows to discovery channels and drains search, and it will do it again in November, at much larger dollar amounts. Do not read Google's $179 as its new baseline, and do not read Meta's $82 as your media buyer's genius. Next week's data should show the give-back, and I will report it either way.
03 / New Customer Acquisition
The full acquisition picture, by channel
Two things beyond the headline. Meta is running 90% new customers, the highest new share of any major channel, which means its cheap acquisition really is acquisition and not repeat business dressed up. And the search-side softness was not just Google: Microsoft's conversion fell harder than anyone's. TikTok gave back its recent volume and returns to thin-data status this week, so I am not reading anything into its swing.
04 / First Click vs Last Click
Who starts the sale vs who takes the bow
This grid explains why holiday weeks fool last-click reporting. The discovery channels that start the sale, Meta especially, are under-credited on last click, while both search channels are over-credited because they close journeys the feed started. In a week where feeds did the heavy lifting, your last-click dashboard handed even more of Meta's holiday work to Google. If you rebalanced budget off that view this week, you rewarded the closer and cut the opener.
05 / Overall Channel Performance
Where the money goes, and THE TRUE COST OF A NEW CUSTOMER
Note the standing trap in this grid. Google still posts nearly 3x Meta's ROAS, and it is still the more expensive place to buy a new customer, by 118% this week. Search ROAS is inflated by closing credit and repeat purchases; Meta's 11% markup between aCAC and nCAC says almost everything it acquires is genuinely new. If you allocate on ROAS alone, this week you would have shifted holiday budget toward the channel whose new customer cost just climbed twice.
06 / New Customer Lifetime Value
What a new customer becomes over a year
The LTV grid is why the holiday split matters beyond one week. A Google new customer is worth $241 at one year against a $179 acquisition cost, so search can absorb some holiday inflation and still pay back. A Meta customer at $111 against $82 is a thinner margin that depends on that cheap nCAC holding. One standing caveat: this grid blends brands at very different price points, so treat it as a directional market benchmark, not a promise for any one store.
07 / Conclusion
Tag both weeks, then wait for the give-back
Two weeks of Labor Day data now say the same thing. Holiday demand flows to discovery and drains search, and last-click reporting hides it by handing the feed's work to the search box. If your Meta looked brilliant and your Google looked broken these two weeks, neither is true. The calendar did both.
The move this week is bookkeeping, not budget. Tag Aug 30 through Sep 12 as holiday-affected in whatever you use to judge performance, benchmark them against past holiday windows instead of ordinary weeks, and write down what your verified nCAC did on each channel. That note is your playbook for Black Friday, when this exact pattern returns with ten times the money on the table. Next issue we find out how much of this snaps back. your own version of these four grids
See your own version of these four grids.
Your real nCAC next to your aCAC, your first versus last click gap, your new customer LTV by channel, in your own account.
Get the Paid Traffic Truth Report directly to your inbox.
How this week's numbers were built. Aggregated across hundreds of Wicked Reports client accounts for the week of September 06 to September 12, 2026, except first click vs last click, which uses a rolling 90 day window. New versus repeat is verified at the order level against first party order IDs, not modeled and not surveyed. The new visit to new customer conversion rate credits the channel that originated the new visit. Channels without cost data, including email, SMS, organic, and influencer, are left out of the cost comparisons. Snapchat is excluded for negligible spend. Pinterest is marked with an asterisk because it ran on a small number of new customers this week, so it is not used to anchor any headline. The channel labeled Facebook in the underlying platform data is shown here as Meta. Charts and tables carry meaning through direction, labels, and contrast rather than color alone.
Topics: Wicked Reports New Customer Acquisition Cost (NCAC) Paid Traffic Truth paid media measurement paid traffic attribution Holiday Demand
7 min read
The Monday Morning Report Is Eating Your Agency's Week

The Monday Morning Report Is Eating Your Agency's Week
Every agency runs the same ritual, and most have stopped noticing how much it costs.
Topics: Wicked Reports agency pain points Agency Strategy agency reporting Wicked Reports Paid Traffic Truth
10 min read
The Paid Traffic Truth : Why Labor Day Made Your Ads Look Smarter Than They Are
The Paid Traffic Truth — Issue 011
Published September 7,2026 * Data for the week of August 30 to September 05 2026 * Aggregated across hundreds of Wicked Reports accounts.
Why Labor Day Made Your Ads Look Smarter Than They Are
The common assumption about a holiday sale week is that demand goes up and so do costs, because everyone is bidding into the same auction. This week's verified data says the first half is true and the second half is backwards. Conversion jumped on nearly every channel, and the cost of a new customer fell almost everywhere. The danger is what your team does with numbers this good.
This week's number
In the Labor Day run-up, Meta's new visit to customer conversion jumped 22% and its nCAC fell to $85. Your ads did not get better. The calendar did.
01 / Introduction
The holiday week test
Every week we aggregate first-party, order-verified data across hundreds of eCommerce accounts and publish the four grids: new customer acquisition, first click versus last click, overall channel performance, and new customer lifetime value. One story per issue. This week the story is what a holiday sale week actually does to your acquisition numbers, because this data week ran from August 30 through September 5, the run-up to Labor Day and the Saturday of the holiday weekend itself.
I want to answer two questions honestly. Did the holiday produce more sales? Yes, clearly. Did it drive costs up? Mostly no, and that surprise is the lesson.
02 / Analysis
More buyers, cheaper new customers, one exception
Here is what the sale week did. New visit to customer conversion rose on almost every channel: Meta up 22%, YouTube up 50%, organic up 30% week over week. Shoppers in a buying mood convert faster on the same clicks. And because conversion rose faster than click prices did, the cost of a verified new customer fell across nearly the whole paid grid. Meta's CPC actually rose about 4%, and its nCAC still dropped to $85.
Now the exception, because it is the most interesting row on the chart. Google was the only major channel where things got worse: conversion down 6%, nCAC up 4% to $161. Holiday demand this week was discovery demand. People scrolling a feed saw a sale and bought. They were not typing product searches into Google. When the buying impulse comes from the calendar instead of from intent, social and video channels harvest it and search sits it out. If you moved budget toward search for the holiday because search is your "reliable" channel, you paid more per new customer than the brands who let the feed channels run.
Here is the honest note, and this week it is the entire point. Every improvement on this page is a calendar artifact, not a structural change. Sale weeks pull demand forward and put shoppers in a converting mood, so every channel's numbers flatter the people running them. The trap is attribution of skill: the media buyer credits the new creative, the platform credits its algorithm, and next week, when a chunk of this demand has been pulled forward and conversion gives some of this back, the same people will be asked what broke. Nothing will have broken. The calendar will have moved on. Benchmark this week against holiday weeks, not against next week. And because this data blends hundreds of accounts, no single brand's promotion moved these aggregates; this is the market-wide holiday effect.
03 / New Customer Acquisition
The full acquisition picture, by channel
Meta had the week you would design on a whiteboard: 88% of its buyers were new, conversion up 22%, and an $85 nCAC, its cheapest of the past month. YouTube's conversion snapped back 50% after last week's slump, pulling its nCAC from $826 down to $520, a reminder that low-volume channels swing hard in both directions. TikTok more than doubled its conversion rate off a small base and cleared the thin-data bar this week, though one good holiday week is not a trend. Google is the row your CFO should ask about, and the answer is in the analysis above.
04 / First Click vs Last Click
Who starts the sale vs who takes the bow
The 90 day pattern held steady through the holiday: last click shortchanges the feed and video channels that open relationships and inflates the search channels that close them. Worth connecting to this week's story: the channels that under-credit on last click are the same ones that harvested the holiday demand. If your reporting is last click, the channels that just delivered your cheapest new customers of the month are the ones your dashboard is quietly punishing.
05 / Overall Channel Performance
Where the money goes, and THE TRUE COST OF A NEW CUSTOMER
Meta's CPC ticked up about 4% this week, the auction pressure everyone expects from a holiday. It did not matter, because conversion rose five times faster than clicks got pricier. That is the cost lesson of a sale week: click prices are the wrong thing to watch. The number that decides whether the holiday was profitable is what a verified new customer cost you, and on every major channel except Google, that number went down. Last week's markup story holds too, ranging from 12% on Meta to 63% on Pinterest, so blended CAC flattered every one of these rows even more than usual.
06 / New Customer Lifetime Value
What a new customer becomes over a year
One question worth asking about a sale week: are discount-driven buyers worth less over time? This grid cannot answer that yet, because these curves are built from cohorts acquired over the past year, not just this week. What it can tell you is the baseline to check against. Meta's holiday cohort came in at an $85 nCAC against a $110 one-year value benchmark, a thin margin that lives or dies on repeat purchase. If this week's cohort tracks below these curves at 30 and 90 days, the cheap holiday customers were not as cheap as they looked. Standard caveat: this grid blends brands at very different price points, so treat it as a directional market benchmark, not a promise for your store.
07 / Conclusion
Give the calendar its credit, then take it back
So, did Labor Day mean more sales or higher costs? More sales, cheaper new customers, and one search-shaped exception. Conversion rose nearly everywhere, nCAC fell on every major channel except Google, and the auction pressure that was supposed to make the holiday expensive never outran the buying mood.
The discipline is to log what actually happened. A holiday week that is not benchmarked as a holiday week becomes false evidence: proof the new creative works, proof the algorithm found its groove, proof you should scale into next week. Verify new versus repeat at the order level, tag the week for what it was, and judge next week against normal weeks. The brands that separate calendar effects from structural ones are the ones that scale the right thing when the holiday glow fades.
How this week's numbers were built. Aggregated across hundreds of Wicked Reports client accounts for the week of August 30 to September 05, 2026, except first click vs last click, which uses a rolling 90 day window. New versus repeat is verified at the order level against first party order IDs, not modeled and not surveyed. The new visit to new customer conversion rate credits the channel that originated the new visit. Channels without cost data, including email, SMS, organic, and influencer, are left out of the cost comparisons. Snapchat is excluded for negligible spend. Pinterest is marked with an asterisk because it ran on a small number of new customers this week, so it is not used to anchor any headline. The channel labeled Facebook in the underlying platform data is shown here as Meta. Charts and tables carry meaning through direction, labels, and contrast rather than color alone.
Topics: Wicked Reports New Customer Acquisition Cost (NCAC) Paid Traffic Truth Seasonal Benchmarking Holiday Conversion Lift
5 min read
Why One Channel Looks Too Cheap and Too Expensive at Once
-Sep-02-2026-08-47-48-4673-AM.png)
Why Your Best Prospecting Channel Looks Both Too Cheap and Too Expensive at the Same Time
Most attribution debates treat measurement error as one problem with one direction. Your dashboard is either too generous to a channel or too harsh on it. Pick a better model, the thinking goes, and the number gets more honest.
Topics: Wicked Reports Marketing Attribution New Customer Acquisition Cost (NCAC) Attribution Software Blended CAC Wicked Reports Paid Traffic Truth
9 min read
The Paid Traffic Truth : The 159% Markup Hiding Inside Your Blended CAC
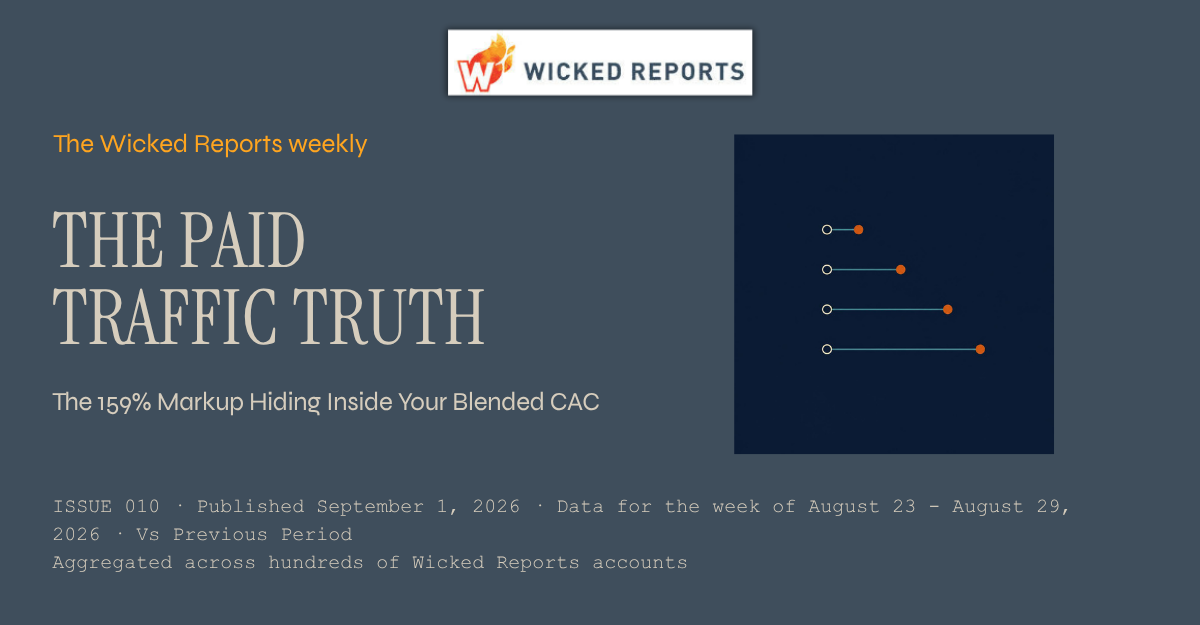
The Paid Traffic Truth — Issue 010
Published September 1,2026 * Data for the week of August 23 to August 29 2026 * Aggregated across hundreds of Wicked Reports accounts.
The 159% Markup Hiding Inside Your Blended CAC
Back in Issue 001 I showed you that the CAC on your dashboard is not the cost of a new customer. It is the cost of any customer, with cheap repeat buyers averaged in. Nine weeks later the pattern has not budged. This week the gap between the two numbers runs from 14% on Meta to 159% on YouTube, and if you budget off the blended number, you are paying for growth you are not getting.
This week's number
YouTube's blended CAC reads $319. A verified first-time customer costs $826. That 159% markup never shows up on a platform dashboard.
01 / Introduction
The two CACs, revisited
Every week we aggregate first-party, order-verified data across hundreds of eCommerce accounts and publish the four grids: new customer acquisition, first click versus last click, overall channel performance, and new customer lifetime value. One story per issue. This week the story is the markup between aCAC, the blended cost of acquiring any customer, and nCAC, the cost of acquiring a customer who has never bought from you before.
We ran this comparison in our very first issue. I am running it again on purpose, because the honest news is persistence. This is not a weekly anomaly you can wait out. It is a structural property of how blended CAC is calculated, and the size of the distortion depends entirely on which channel you are looking at.
02 / Analysis
Every channel marks up its blended CAC. Not equally.
The mechanism is simple. Blended CAC divides spend by all customers acquired, new and repeat alike. Repeat buyers convert cheaply because they already know you, so every repeat purchase mixed into the denominator pulls the average down. The more a channel leans on people who have already bought, the more flattering its blended CAC looks, and the bigger the surprise when you isolate true new customers.
Look at the shape of that chart. Meta's line is barely visible, a 14% markup, because 87% of Meta's tracked buyers this week were genuinely new. Meta's blended number and its new customer number are nearly the same number. Google marks up 51% at 66% new. Microsoft marks up 67% at 60% new. Then there is YouTube, where only 39% of buyers were new, and the markup explodes to 159%. The rule holds across the whole grid: the lower a channel's share of new buyers, the bigger the lie in its blended CAC.
One honest note on this week's magnitude. The markup pattern itself is structural. It comes from arithmetic and channel mix, not from the calendar, and it will look similar next week and the week after. But YouTube's specific 159% figure is elevated this week because YouTube's new visit to customer conversion dropped sharply week over week, which pushed its nCAC up hard while blended CAC moved less. Late August is a quiet stretch with no holiday selling event to blame, so read the direction as permanent and this week's YouTube extreme as the high end of its normal range. And because this data blends hundreds of accounts, no single brand's promotion can move these aggregates.
03 / New Customer Acquisition
The full acquisition picture, by channel
Meta keeps its spot as the volume engine, and at 87% new it is doing the job most brands assume all their paid channels are doing: bringing in people who have never bought. Google converts steadily at a defensible $154 nCAC. The row to sit with is YouTube. Only 39% of its buyers were new, its conversion rate fell by half week over week, and its nCAC landed at $826. If your dashboard shows YouTube at its blended $319, you are looking at a number that is mostly repeat purchase behavior wearing a prospecting costume.
04 / First Click vs Last Click
Who starts the sale vs who takes the bow
Same pattern as always: the social and video channels that open relationships get shortchanged by last click, and the search channels that close them get inflated. Notice this cuts the opposite way from the markup story. Last click makes YouTube look slightly worse than it is on revenue credit, while blended CAC makes it look wildly better than it is on new customer cost. Two different distortions, one channel, and neither one visible if you only run one report.
05 / Overall Channel Performance
Where the money goes, and THE TRUE COST OF A NEW CUSTOMER
Read the markup column top to bottom. Every single paid channel costs more per new customer than its blended CAC admits. There is no channel where the blended number is honest. The only question is how big the markup is, and the answer ranges from a rounding error on Meta to more than double on YouTube. If your growth model uses one CAC for the whole business, your model is built on the most flattering version of every channel simultaneously.
06 / New Customer Lifetime Value
What a new customer becomes over a year
Here is the fairness clause for YouTube. Its new customers start small at $84 and nearly triple to $244 by one year, still the steepest growth curve in the set, a pattern we covered in depth in Issue 008. That back-end value is real, but it does not erase an $826 nCAC. It means YouTube is a channel you evaluate on a payback window, not on week-one math, and definitely not on blended CAC. One caveat that applies to this whole grid: it blends brands at very different price points, so treat it as a directional market benchmark, not a promise for your store.
07 / Conclusion
One business, two CACs. Budget off the right one.
The blended CAC on your dashboard is answering a question you did not ask. You want to know what growth costs. It is telling you what activity costs, with your cheapest, most loyal buyers averaged in to make every channel look better than it is. Nine issues into this series, the markup between the two numbers has shown up every single week, on every paid channel, without exception.
The fix is not more reporting. It is verifying new versus repeat at the order level, pricing each channel by its true nCAC, and then making Scale, Chill, or Kill decisions off that number. Meta at a $88 nCAC and 87% new is a different decision than YouTube at $826 and 39% new, even though blended CAC says they are $77 and $319. Know which number you are looking at before you move the budget.
How this week's numbers were built. Aggregated across hundreds of Wicked Reports client accounts for the week of August 23 to August 29, 2026, except first click vs last click, which uses a rolling 90 day window. New versus repeat is verified at the order level against first party order IDs, not modeled and not surveyed. The new visit to new customer conversion rate credits the channel that originated the new visit. Channels without cost data, including email, SMS, organic, and influencer, are left out of the cost comparisons. Snapchat is excluded for negligible spend. Pinterest is marked with an asterisk because it ran on a small number of new customers this week, so it is not used to anchor any headline. The channel labeled Facebook in the underlying platform data is shown here as Meta. Charts and tables carry meaning through direction, labels, and contrast rather than color alone.
Topics: Wicked Reports New Customer Acquisition Cost (NCAC) Paid Traffic Truth YouTube Ads CAC Markup Blended CAC
6 min read
How to Track SEO & Content ROI in 2026 (Zero-Click Era)
-2.png)
HOW TO TRACK THE ROI OF SEO AND CONTENT IN 2026
SEO and content are the marketing everyone believes in and almost nobody measures properly. You publish, you rank, traffic grows, and yet when finance asks what that content actually earned, the honest answer is usually a shrug. It is the hardest channel to attribute, and in 2026 it got harder, because a growing share of the influence your content has now happens with no click at all. Here is how to track the real ROI of SEO and content, including the parts that no longer show up as a visit.
Topics: Wicked Reports Marketing Attribution content marketing SEO ROI zero click search
9 min read
The Paid Traffic Truth : Why Your Priciest Ad Channel Grows the Fastest Customers
.png)
The Paid Traffic Truth — Issue 009
Published August 24,2026 * Data for the week of August 16 to August 22 2026 * Aggregated across hundreds of Wicked Reports accounts.
The Day Zero Trap: Your Priciest Channel Grows the Fastest Customers
Most operators judge a channel on what a customer spends the day they arrive. This week's data shows why that math quietly kills your fastest compounding channels. The customers who look worst on day zero are growing in value twice as fast as the ones who look best.
This week's number
A YouTube new customer nearly doubles in value in 30 days: $104 at first order, $199 by day 30, $235 at one year. Judge it on day zero and you miss more than half the value.
01 / Introduction
One story, four grids, hundreds of verified accounts
Every week I aggregate first party, order verified data across hundreds of eCommerce accounts and publish what the ad platforms will not show you. One story leads, and the same four grids follow: new customer acquisition, first click versus last click, overall channel performance, and new customer lifetime value. No modeled conversions, no surveys, no platform grading its own homework.
This week's story lives in the lifetime value grid. YouTube posts the ugliest new customer cost of any major paid channel, and it also grows the most valuable customer curve of any major paid channel. Both things are true at once, and if your measurement stops at day zero, you only ever see the first one.
02 / Analysis
Day zero revenue understates video customers by more than 2x
Here is the setup. A Meta new customer spends $64 on their first order. A YouTube new customer spends $104. On day zero, both look thin against their acquisition costs, and YouTube looks worst of all at a $478 nCAC. So the standard move is to kill the video spend and pour it back into whatever converts cheapest today. Now watch what happens after day zero.
A YouTube customer goes from $104 to $199 in 30 days. That is a 91% jump in one month, the steepest early payback curve of any channel with meaningful spend. By one year they are worth $235, a 2.26x multiple on their first order. TikTok shows the same shape at 2.29x. Meanwhile Meta, the cheap channel everyone trusts, grows its $64 first order to just $99, a 1.56x multiple, and Google manages only 1.36x. The channels that look worst on day zero compound the fastest. And to be clear about what the data does not say: even at one year, click credited revenue alone does not cover YouTube's $478 nCAC. That is the second half of the trap. The first versus last click grid below shows YouTube is under credited on last click, and none of these click based numbers count view driven purchases at all. Day zero math understates the customer by half, and click only credit understates the channel on top of it. Stack those two errors and killing video looks like discipline when it is actually a blind spot.
The honest read on this week: this is a structural pattern, not a calendar artifact. Video first channels acquire customers with lighter first orders that compound, and the shape holds across YouTube and TikTok in the same grid, in a plain late August week with no holiday selling event to distort it. Because this is aggregated across hundreds of accounts, no single brand's promotion can move these curves. What did move this week for calendar reasons is conversion rate, which dipped across most channels in typical late summer fashion. The LTV grid is built on a full year of cohort behavior, so the weekly dip does not touch the story.
03 / New Customer Acquisition
The full acquisition picture, by channel
Notice the pattern in the % new column. The expensive video channels bring in the freshest buyers: 79% of YouTube's customers and 81% of TikTok's are first timers, versus 65% on Google and 59% on Microsoft. Video is doing prospecting work. Search is, in large part, closing demand that already exists. Conversion rates softened across most channels this week, a normal late summer move, with YouTube's new visit to customer rate down 15% week over week.
04 / First Click vs Last Click
Who starts the sale vs who takes the bow
Same story it always tells, and this week it stacks on top of the LTV story. YouTube reads 0.49 on first click but only 0.42 on last click, because it starts journeys that search and email finish. Google and Microsoft read higher on last click than first, because they take the bow at the end of journeys someone else started. If your reporting is last click and day zero, video channels get penalized twice: once for starting sales they do not get credit for closing, and once for acquiring customers whose value has not shown up yet.
05 / Overall Channel Performance
Where the money goes, and THE TRUE COST OF A NEW CUSTOMER
Meta and Google together carry 91% of tracked spend, so the market has voted for cheap day zero acquisition. Fair enough. But look at the ROAS column with fresh eyes: the best weekly ROAS in the set belongs to Microsoft at 1.89, a channel where only 59% of buyers are new and last click over credits it by 0.46. High weekly ROAS keeps correlating with closing existing demand, not creating new customers. Cheap and compounding are different things, and this grid only shows you cheap.
06 / New Customer Lifetime Value
What a new customer becomes over a year
Sorted by growth multiple, the video and social channels own the top of this grid while search sits near the bottom. A Google customer arrives spending $164 and grows only 36% in a year. A YouTube customer arrives spending $104 and more than doubles. Pinterest posts the steepest multiple at 2.65x, but it runs on very little spend and very few new customers this week, so treat it as a footnote, not a finding. One standing caveat: this grid blends brands at different price points, so it is a directional market benchmark, not a promise for any one store.
07 / Conclusion
Stop grading a compounding asset on its opening day
Every channel in your account is being judged by a number, and for most operators that number is built from day zero revenue and last click credit. This week's data shows exactly which channels that math executes: the video channels acquiring your freshest customers with the fastest growing value curves. Nobody decides to kill their best prospecting engine. They just use a measuring stick that makes killing it look responsible.
The fix is not faith in video. It is measurement that follows the customer past day zero and past the last click. Know your real nCAC by channel, know what a new customer from each channel is worth at 30, 90, and 365 days, and make Scale, Chill, and Kill calls on that, not on a screenshot of week one ROAS. The channels compound. Your measurement should too.
How this week's numbers were built. Aggregated across hundreds of Wicked Reports client accounts for the week of August 16 to August 22, 2026, except first click vs last click, which uses a rolling 90 day window. New versus repeat is verified at the order level against first party order IDs, not modeled and not surveyed. The new visit to new customer conversion rate credits the channel that originated the new visit. Channels without cost data, including email, SMS, organic, and influencer, are left out of the cost comparisons. Snapchat is excluded for negligible spend. Pinterest is marked with an asterisk because it ran on a small number of new customers this week, so it is not used to anchor any headline. The channel labeled Facebook in the underlying platform data is shown here as Meta. Charts and tables carry meaning through direction, labels, and contrast rather than color alone.
Topics: Wicked Reports first click vs last click Paid Traffic Truth YouTube Ads paid traffic attribution new customer lifetime value
10 min read
The Paid Traffic Truth : Which Way Is Last-Click Attribution Wrong? One Direction
The Paid Traffic Truth — Issue 008
Published August 17,2026 * Data for the week of August 09 to August 15 2026 * Aggregated across hundreds of Wicked Reports accounts.
Last Click Moves Money in One Direction. Toward the Closer.
Everyone knows last click is imperfect. Almost nobody knows which direction it is wrong in. This week's verified data shows the error is not random noise. It runs one way, every time, and it decides which of your channels gets fed and which gets starved.
This week's number
On the same 90 day window, last click gives Google 12% more credit than first click (1.53 → 1.71 ROAS) while stripping 23% of Meta's (0.39 → 0.30). Same journeys. Opposite errors.
01 / Introduction
The error in your attribution is not random. It has a direction.
Every week I pull one story out of the same four grids: new customer acquisition, first click versus last click, overall channel performance, and new customer lifetime value. All of it is first-party, click-verified, and aggregated across hundreds of eCommerce accounts. No modeling, no surveys, no platform grading its own homework.
This week's story is the first versus last click grid, because it shows something most operators have never actually measured: which way last click lies. When you line up first click and last click ROAS for the same channels over the same 90 days, the shift is systematic. Credit flows away from the channels that open journeys and toward the channels that close them. If your budget decisions run on last click, you are not just working with imprecise numbers. You are working with numbers biased in a specific, predictable direction.
02 / Analysis
Same journeys, same window, opposite errors
Here is the comparison. First click asks "who started this sale?" Last click asks "who was standing there when it closed?" Both are looking at the exact same set of purchases. If attribution error were random, some weeks Google would gain credit under last click and some weeks it would lose it. That is not what happens. In this week's data, Google's ROAS reads 1.53 on first click and 1.71 on last click. Meta reads 0.39 on first click and 0.30 on last click. Last click hands Google a 12% raise and hands Meta a 23% pay cut, on the same customer journeys.
The pattern holds across the grid. Microsoft, a classic bottom-of-funnel search channel, gains the most:2.32on first click becomes2.79on last click, a 20% boost from the measurement method alone. YouTube, a discovery channel, loses 16%. The channels that introduce your brand to a stranger get their credit taken and handed to the channels that catch that same stranger a week later when they search for you by name. Now connect this to cost: Meta acquired new customers at$93nCAC this week versus Google's$143. The channel last click punishes is the cheaper place to buy a new customer. The channel last click flatters costs 54% more per new customer. If you rebalance budget on last click ROAS, you move money toward the expensive closer and away from the cheap opener, and your new customer growth stalls while your reported ROAS improves.
Is this a calendar artifact or a structural pattern? Structural. There is nothing special about a mid-August week, no holiday, no seasonal spike, and the direction of the credit shift matches how these channels function: search intercepts demand that already exists, social and video create it. Because the cause is the mechanics of the channels themselves, expect this same directional bias in your account next week and the week after, at whatever magnitude your mix produces. And because this data is aggregated across hundreds of accounts, no single brand's promotion can move these numbers. Pinterest is marked as a thin channel this week and is not used to anchor any conclusion here.
03 / New Customer Acquisition
The full acquisition picture, by channel
Look at the % new column next to the credit shift from section 02. Meta is 89% new customers, the highest share of any major paid channel, and it is the channel last click penalizes hardest. Microsoft is 58% new, the lowest, and it is the channel last click rewards most. The measurement method is systematically shifting credit from the channels doing your acquisition work to the channels harvesting demand that already existed. Meta's nCAC also improved about 4% week over week while its new-visit conversion ticked up, so the penalized channel got cheaper, not worse.
04 / First Click vs Last Click
Who starts the sale vs who takes the bow
This is the week's grid to sit with. Every search channel gains credit when you switch from first click to last click. Every social and video channel loses it. Six channels, one direction of error. If someone tells you last click is "close enough," ask them close enough in which direction, because the answer determines whether you are quietly starving the channels that bring you new customers.
05 / Overall Channel Performance
Where the money goes, and THE TRUE COST OF A NEW CUSTOMER
Meta and Google together carry about 91% of tracked spend, so those two rows are where budget decisions actually get made. Notice the shape: the channels with the best ROAS also carry the biggest nCAC markup over aCAC. Microsoft posts a 2.12 ROAS with a 72% markup, meaning a big share of that return is existing customers repurchasing. Meta posts the ugliest ROAS on the board and the cheapest verified new customer at $93 with only a 12% markup. ROAS and new customer efficiency are not the same metric, and this week they point in opposite directions.
06 / New Customer Lifetime Value
What a new customer becomes over a year
Meta's day 0 value is the lowest on the board at $63, growing 1.56x to $98 by one year. That matters for the story above: a channel that opens journeys with a small first order will always look terrible on a short-window last click ROAS, because most of its value shows up later and gets credited to whoever closed. One caveat that applies every week: this grid blends brands at very different price points, so treat it as a directional market benchmark, not a promise for any one store.
07 / Conclusion
Stop asking if last click is wrong. Ask which way it is wrong.
This week's data settles the direction question. Last click over-credits closers (Google +12%, Microsoft +20%) and under-credits openers (Meta −23%, YouTube −16%), on the same journeys over the same 90 days. It does this because of how the channels work, not because of anything on the calendar, which means it did it last week and it will do it next week, inside your account too.
The fix is not a better opinion. It is a better measurement layer: tie every order to the verified clicks that preceded it, separate new customers from repeat at the order level, and judge each channel by its actual job. Openers get judged on verified nCAC and what that customer becomes over a year. Closers get judged on efficiency capturing demand. When you do that, the $93 versus $143 comparison becomes the number you defend to finance, instead of a ROAS column that grades the closer's homework with the opener's work.
How this week's numbers were built. Aggregated across hundreds of Wicked Reports client accounts for the week of August 02 to August 08, 2026, except first click vs last click, which uses a rolling 90 day window. New versus repeat is verified at the order level against first party order IDs, not modeled and not surveyed. The new visit to new customer conversion rate credits the channel that originated the new visit. Channels without cost data, including email, SMS, organic, and influencer, are left out of the cost comparisons. Snapchat is excluded for negligible spend. Pinterest is marked with an asterisk because it ran on a small number of new customers this week, so it is not used to anchor any headline. The channel labeled Facebook in the underlying platform data is shown here as Meta. Charts and tables carry meaning through direction, labels, and contrast rather than color alone.
Topics: Wicked Reports New Customer Acquisition Cost (NCAC) last click attribution first click vs last click Paid Traffic Truth
6 min read
How to Build UTM Tracking Links in Wicked Reports
-3.png)
HOW TO BUILD UTM TRACKING LINKS IN WICKED REPORTS: THE SETUP THAT MAKES ATTRIBUTION WORK
Accurate attribution has one unglamorous prerequisite that trips up more brands than any dashboard ever will. Your marketing links have to be tagged so the system can tell where a click came from. Without proper UTM tracking on your links, even the best attribution tool is guessing. The good news is that Wicked Reports builds these links for you, so you never have to hand-write a UTM string or worry about getting the format wrong. Here is how to do it, and why it matters.
Topics: Wicked Reports UTM Tracking attribution setup campaign tracking tracking links
10 min read
The Paid Traffic Truth : Why Last-Click Attribution Cuts Meta's ROAS and Pays Search
The Paid Traffic Truth — Issue 007
Published August 10,2026 * Data for the week of August 02 to August 08 2026 * Aggregated across hundreds of Wicked Reports accounts.
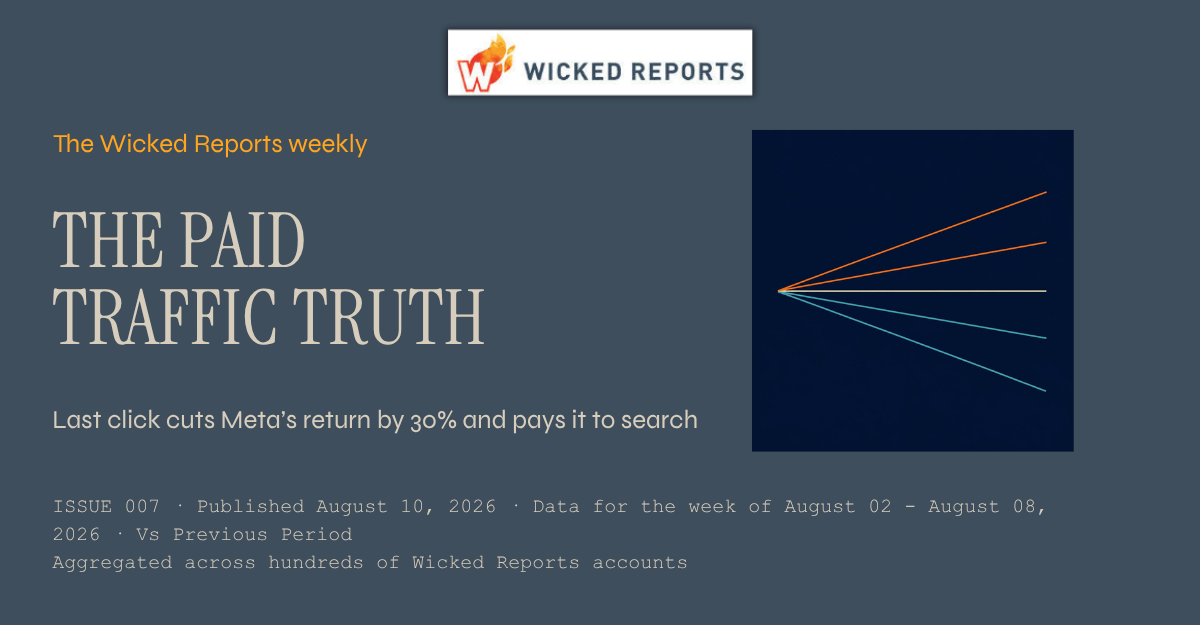
Last click cuts Meta’s return by 30% and pays it to search
I ran the same 90 days of verified orders through two attribution windows this week and got two different winners. On first click Meta returns 0.43 and Google returns 1.54. On last click Meta drops to 0.30 and Google climbs to 1.72. If your budget meeting uses the second number, you are about to defund the channel that started the sales you are celebrating.
This week's number
Move from first click to last click and Meta’s ROAS falls 30%, while Google’s rises 12% and Microsoft’s rises 22%. Same orders, same revenue, same 90 days. Only the credit moved.
01 / Introduction
Two attribution windows, two different winners, one set of orders
Every week I pull new customer economics from hundreds of Wicked Reports accounts, verified at the order level against first party order IDs. Not modeled. Not surveyed. This week the interesting number is not a performance number at all. It is an accounting number.
Below you get the story first, then the four grids: new customer acquisition, first click versus last click, overall channel performance, and new customer lifetime value. The story this week is what happens to your channel ranking when you change nothing except which click gets the credit.
02 / Analysis
Nobody performed differently. The credit moved.
Take every order in the trailing 90 days and give 100% of the revenue to the first click that touched it. Then run it again and give 100% to the last click. Same orders, same revenue, same spend in the denominator. The only thing that changes is who gets paid on paper. Here is what that swap does to each channel, with every channel indexed to its own first click result so you can see the direction rather than the absolute level.
Meta loses 30% of its measured return on the switch. Google gains 12% and Microsoft gains 22%. YouTube loses 16%. The pattern is not random and it is not about ad quality. Social channels get found early in a buying decision, and search gets typed in at the end, so a last click model quietly hands social’s work to search and calls it search performance. The acquisition grid says the same thing from the other direction: 90% of Meta’s customers this week were brand new, against 66% on Google and 58% on Microsoft. The channel bringing you the most first time buyers is the channel last click punishes hardest.
Is this a calendar effect? The first week of August is a quiet stretch, past the July promo cycle and not yet into back to school and Labor Day, so a soft social week would be an easy explanation. I do not think that is what this is. The first click versus last click comparison runs on a rolling 90 day window, not on the week, and the direction of the gap has been consistent: prospecting channels open sales and search closes them. That makes it structural, and structural means it will be true again next week. The number I would treat as genuinely calendar sensitive is Google’s nCAC, up 12% week over week to $148, with the click price up about 5% and new customer conversion down about 4%. That is a mix and auction move worth watching, not a verdict.
03 / New Customer Acquisition
The full acquisition picture, by channel
Read the last two columns together. Meta converts new visits to new customers at 2.5% and delivers new customers at $96, and 90% of what it delivers is a first time buyer. Google converts at 2.3% but a new customer costs $148, and a third of its customers were already yours. Microsoft is the most expensive new customer in the set at $160 and the least new at 58%. YouTube and TikTok are prospecting channels that are honest about it: 82% and 77% new, at $395 and $344. Pinterest is marked with an asterisk because it produced very few new customers this week, so its rates swing wildly and it anchors nothing in this issue.
04 / First Click vs Last Click
Who starts the sale vs who takes the bow
The credit gap column is last click minus first click. Negative means the channel starts sales it does not get paid for. Meta and YouTube are both under credited, Google and Microsoft are both over credited, and TikTok is close to even. Microsoft has the widest single gap at 0.56, which is a good reminder that a 3.07 ROAS on a closing channel is not the same claim as a 3.07 ROAS on a channel that found the customer. If you only ever look at one of these two columns, you are not measuring performance, you are choosing a winner in advance.
05 / Overall Channel Performance
Where the money goes, and THE TRUE COST OF A NEW CUSTOMER
Meta carries 55% of tracked spend and posts the weakest headline ROAS of the two big channels at 0.51, and yet it produces the cheapest new customer in the set at $96, only 12% above its blended aCAC. Google is the reverse: a 1.44 ROAS, and a new customer that costs 49% more than its blended number suggests. Microsoft is the sharpest version of the trap, a 2.25 ROAS sitting on a 72% nCAC markup. Note that the ROAS in this grid is the weekly full funnel figure, which is a different measure from the 90 day first and last click columns in section 04. Compare them for direction, not level.
06 / New Customer Lifetime Value
What a new customer becomes over a year
This grid blends brands at very different price points, so treat it as a directional market benchmark rather than a promise for your store. The line I would stare at is Meta: a new customer worth $63 on the first order and $97 after a year, against a $96 nCAC. In aggregate, Meta new customers take a full year to pay back the cost of acquiring them, on revenue, before margin. Google new customers start at $160 and reach $219, so they cover a $148 nCAC much faster. That is the real trade behind the credit argument, and it is why I want both attribution views before I move budget rather than after.
07 / Conclusion
Pick your attribution window before you pick your winner
Nothing in this week’s data says Meta is good and Google is bad. It says the ranking of your channels is partly a choice you already made when you picked an attribution model, and most teams made that choice by accident, by using whatever the ad platform reported. Judge on last click and you will cut the channel that opens sales in order to fund the channel that closes them. Do that for two quarters and the closer runs out of people to close.
The practical fix is small. Put first click and last click side by side, then buy on nCAC and nLTV rather than on either ROAS number alone. This week that means Meta is the cheapest source of first time buyers you have, with a payback period of about a year that you need to underwrite deliberately, and Google is an efficient closer that is being credited for demand it did not create. Both facts are true at once, and you can only see both if you refuse to let one model do all the talking.
How this week's numbers were built. Aggregated across hundreds of Wicked Reports client accounts for the week of August 02 to August 08, 2026, except first click vs last click, which uses a rolling 90 day window. New versus repeat is verified at the order level against first party order IDs, not modeled and not surveyed. The new visit to new customer conversion rate credits the channel that originated the new visit. Channels without cost data, including email, SMS, organic, and influencer, are left out of the cost comparisons. Snapchat is excluded for negligible spend. Pinterest is marked with an asterisk because it ran on a small number of new customers this week, so it is not used to anchor any headline. The channel labeled Facebook in the underlying platform data is shown here as Meta. Charts and tables carry meaning through direction, labels, and contrast rather than color alone.
Topics: Wicked Reports New Customer Acquisition Cost (NCAC) Attribution Window Return on Ad Spend (ROAS) first click vs last click Paid Traffic Truth
10 min read
The Paid Traffic Truth : Why Your Best ROAS Channels Bring the Fewest New Customers
.png)
The Paid Traffic Truth — Issue 005
Published August 03,2026 * Data for the week of July 26 to August 01 2026 * Aggregated across hundreds of Wicked Reports accounts.
WhyYour Best ROAS Channels Bring the Fewest New Customers
A calm week, which is the best time to see a structural truth clearly. Sort your channels by ROAS this week and watch the share of customers who are actually new fall as you climb the list. The channels posting the best returns are the ones doing the least to grow your customer base.
This week's number
Google's ROAS is 3x Meta's, yet 89% of Meta's customers are brand new against 68% of Google's. Microsoft posts the best ROAS in the set at 2.76 and the lowest new share at 59%. The better the ROAS, the more of it is repeat business.
01 / Introduction
A quiet week, and two things that settled down
Welcome to the sixth edition of the Paid Traffic Truth. This was a quiet week, and I am not going to dress it up. Two things I flagged recently both settled in the calm direction. Meta's late July cost bump leveled off, with new customer conversion ticking back up a touch, which is what you would expect if that was a seasonal dip rather than a real problem. And Microsoft's ROAS, which had slipped three weeks running, bounced back this week.
With no fire to put out, a quiet week is the right time to look at something that is always true but easy to miss when a number is jumping around. It sits in plain sight in this week's grids. Every figure is first party and order verified, aggregated across hundreds of ecommerce brands.
02 / Analysis
Rank by ROAS and the new-customer share runs the other way
Take this week's channels and line them up by ROAS, best to worst. Microsoft leads at 2.76, then Google at 1.54, then the video and social channels trail with Meta at 0.51 and TikTok at 0.27. Standard picture. Now add one column next to it: the share of each channel's customers who are actually new to the brand.
The two columns point in opposite directions. Microsoft, the ROAS leader, is only 59% new. Google is 68% new. Meta, near the bottom on ROAS, is 89% new. YouTube is 85%. The higher a channel sits on ROAS, the smaller the fraction of its customers who are people you did not already have.
This is not a coincidence, it is how the metric is built. A channel like Google or Microsoft captures a lot of demand at the moment of purchase, and a good chunk of that demand is existing customers coming back to buy again. Those repeat orders are cheap to win and they land in the channel's revenue, so its ROAS looks strong. Meta and the video channels spend most of their effort in front of people who have never bought from you, which is harder and converts lower, so their ROAS looks weak even though they are doing the actual work of growing the business.
Put plainly, ROAS quietly rewards a channel for reselling to people you already have. The two dominant channels this week make the point on their own. Google's ROAS is three times Meta's, but roughly a third of Google's customers are repeat buyers, against barely one in ten on Meta. If you shift budget toward the higher ROAS number, you are partly paying to harvest demand you would likely have captured anyway, and starving the channel bringing in new humans.
The honest caveat, because this cuts both ways. A high repeat share is not a sin, closing existing demand efficiently is a real job and someone has to do it. The point is not that Google is bad and Meta is good. It is that ROAS alone cannot tell you which job a channel is doing, and if growth is your goal, the share of new customers belongs right next to the ROAS number, not three columns away. This is a quiet, no-drama week across the board, so read this as a standing structural feature of the data, not a one-week event.
03 / New Customer Acquisition
The full acquisition picture, by channel
Sorted by new share this time, so the pattern from the chart reads top to bottom. Meta and the video channels sit up top doing the prospecting, and by the time you reach the bottom of the list you are looking at the channels with the strongest ROAS. Meta held steady with conversion up a couple of points, the leveling off mentioned earlier. YouTube and TikTok conversion slipped on small volume, so treat those as wobbles. Pinterest ran thin again and carries an asterisk.
04 / First Click vs Last Click
Who starts the sale vs who takes the bow
This grid reinforces the same idea from a different direction. The channels that close, Google and Microsoft, gain ROAS on the last click model, the one closest to what platforms report. The channels that open, Meta and Pinterest, lose it. So the channel doing the most new customer work is also the one most likely to be under credited when you look at platform numbers. Two ways of measuring, same conclusion about who gets shortchanged.
05 / Overall Channel Performance
Where the money goes, and THE TRUE COST OF A NEW CUSTOMER
The markup column tells the same story a third way. Look at where the gap between blended cost and true new customer cost is widest. Microsoft at 69% and Google at 47%. Those are the high ROAS channels, and the wide gap is the tell that a lot of their cheap blended cost is repeat business. Meta's markup is just 12%, because almost everyone it brings in is new, so its blended and new customer costs are nearly the same number. Microsoft's ROAS rebound to 2.76 this week is worth noting after three down weeks, though at 2.4% of spend it does not move the overall picture.
06 / New Customer Lifetime Value
What a new customer becomes over a year
The value grid adds the missing dimension to the whole discussion. A new customer is worth roughly one and a half times their first order within a year on most channels, and more than double on TikTok and Pinterest. That value only accrues if you keep acquiring new customers, which loops right back to the point. The channels earning the applause on ROAS are not the ones filling this table with new names. As always, this blends hundreds of brands at different price points, so treat it as a directional benchmark, not a promise for your store.
07 / Conclusion
ROAS answers a question you did not ask
ROAS tells you how much revenue a channel returned per dollar spent. It does not tell you how many new customers that dollar bought, and this week it quietly told you the opposite, because the highest returns came from the channels doing the least prospecting. On a loud week that is easy to miss. On a quiet week like this one it is sitting right there in the grids.
If growth is the goal, the share of new customers and the verified cost to acquire them belong next to ROAS, not buried three columns over. Watch all three together and you stop mistaking efficient reselling for growth.
How this week's numbers were built. Aggregated across hundreds of Wicked Reports client accounts for the week of July 26 to August 01, 2026, except first click vs last click, which uses a rolling 90 day window. New versus repeat is verified at the order level against first party order IDs, not modeled and not surveyed. The new visit to new customer conversion rate credits the channel that originated the new visit. Channels without cost data, including email, SMS, organic, and influencer, are left out of the cost comparisons. Snapchat is excluded for negligible spend. Pinterest is marked with an asterisk because it ran on a small number of new customers this week, so it is not used to anchor any headline. The channel labeled Facebook in the underlying platform data is shown here as Meta. Charts and tables carry meaning through direction, labels, and contrast rather than color alone.
Topics: Wicked Reports New Customer Acquisition Cost (NCAC) Return on Ad Spend (ROAS) Paid Traffic Truth paid traffic attribution
9 min read
The Paid Traffic Truth : Why Your Meta Cost Rose but Your Click Price Didn't
The Paid Traffic Truth — Issue 005
Published July 27,2026 * Data for the week of July 19 to July 25 2026 * Aggregated across hundreds of Wicked Reports accounts.
Meta got a little more expensive. The click price says it isn't you
Most of the board is quiet this week, which is its own kind of news. One number moved that is worth two minutes: after two weeks pinned at $84, Meta's new customer cost rose to $91. Before you blame your creative, look at what did not move. The click price. What moved was conversion, and it moved across hundreds of accounts at once.
This week's number
Meta's cost to acquire a new customer rose 8% to $91, its first move in three weeks. Cost per click held flat at $1.09. The entire increase came from new customer conversion slipping from 2.7% to 2.4%.
01 / Introduction
Sometimes the report is mostly status quo
Welcome to the fifth edition of the Paid Traffic Truth. Not every week hands you a dramatic reversal, and pretending otherwise is how benchmarks lose your trust. This week Google, YouTube, and TikTok all held roughly where they were. The grids below will look familiar, and that is fine. A steady week is information too.
But one number moved, and it happens to be the biggest channel on the board, so it earns a closer look. Every figure here is first party and order verified, aggregated across hundreds of ecommerce brands.
02 / Analysis
The click price held. Conversion is what moved.
Here is the reflex when your Meta new customer cost jumps. You assume the creative is fatiguing, or the algorithm turned on you, or the auction got more expensive. So you start tearing things apart. This week the aggregate data says slow down, because the usual suspect has an alibi.
Meta's cost per click this week was $1.09. The week before it was $1.10. It did not move. If the auction had gotten more expensive, that is the number that would have climbed, and it didn't. So the 8% rise in new customer cost, from $84 to $91, did not come from paying more for traffic.
It came from the other side of the equation. The rate at which a new visitor turned into a new customer fell from 2.7% to 2.4%, an 11% drop. Same priced clicks, fewer of them converting. That is what pushed the cost per new customer up. New customer volume fell too, down 14% on the week and down about 18% across the last three weeks.
Now the important part, and the reason this is a benchmark and not just your dashboard. A drop from 2.7% to 2.4% inside your own account is impossible to read. It could be your creative, your landing page, your offer, or nothing you did at all. You cannot tell from the inside. But when the same softening shows up across hundreds of accounts in the same week, with click prices flat, the most likely explanation is not that everyone's creative fatigued on the same Monday. It is late July. Demand softens, browsers convert a little worse, and the cost of a new customer drifts up for a few weeks. This reads as a market tide, not an account failure.
Notice what would have hidden this. Meta's blended ROAS held at 0.52, exactly where it has sat all month. If ROAS were your only gauge, this week looks identical to the last two and you would see nothing to explain. The move only shows up when you watch verified new customer cost and the pieces underneath it, the click price and the conversion rate, separately.
03 / New Customer Acquisition
The full acquisition picture, by channel
Meta is still the cheapest new customer in the set at $91 and still 89% new, so it has not stopped being the prospecting engine. It just got a little harder to run this week. Google was flat, its conversion up a single point. YouTube's conversion rose 15% but off a small base, so read it as a wobble, not a trend. Pinterest ran on very few new customers and carries an asterisk, so it anchors nothing.
04 / First Click vs Last Click
Who starts the sale vs who takes the bow
No surprises here, and that is expected from a rolling 90 day window. Last click still hands credit to the channels that close, Google and Microsoft, and still shorts Meta, the channel that opens. Worth noting only because it frames this week's Meta story: the channel already gets under credited on the way sales are reported, so a soft conversion week makes an easy target look even easier to cut. Resist that.
05 / Overall Channel Performance
Where the money goes, and THE TRUE COST OF A NEW CUSTOMER
Meta and Google are again about 93% of tracked spend. Meta's aCAC and nCAC both stepped up together while the markup between them held at 11%, which is another sign this was demand softening rather than a shift in who Meta is bringing in. One quiet item worth a bookmark: Microsoft's ROAS has now slid three weeks running, 2.60 to 2.32 to 2.00. Still the highest ROAS on the board, but the direction is worth watching if it continues.
06 / New Customer Lifetime Value
What a new customer becomes over a year
The value grid barely moved, which matters for reading the Meta story correctly. Meta's one year value held at $97. So the customers Meta acquired this week are worth about what they were worth last week. The change was in how many converted and at what cost, not in who they turn out to be. Microsoft still tops the set at $366. As always, this blends hundreds of brands at different price points, so treat it as a directional benchmark, not a promise for your store.
07 / Conclusion
Knowing it is the market is the whole point
A quiet week with one moving number is a good test of whether your measurement is worth anything. If all you had was blended ROAS, this week was invisible. If all you had was your own account, an 8% rise in new customer cost looks like a fire drill. Neither would tell you the truth, which is that clicks cost the same, conversion softened for a few weeks across the whole market, and the customers are still worth what they were.
That is the difference between panic cutting a channel in late July and holding your nerve because you can see it is the tide, not your boat. You get there with verified new customer cost and the pieces underneath it, not a single blended number that hides the whole thing.
How this week's numbers were built. Aggregated across hundreds of Wicked Reports client accounts for the week of July 19 to July 25, 2026, except first click vs last click, which uses a rolling 90 day window. New versus repeat is verified at the order level against first party order IDs, not modeled and not surveyed. The new visit to new customer conversion rate credits the channel that originated the new visit. Channels without cost data, including email, SMS, organic, and influencer, are left out of the cost comparisons. Snapchat is excluded for negligible spend. Pinterest is marked with an asterisk because it ran on a small number of new customers this week, so it is not used to anchor any headline. The channel labeled Facebook in the underlying platform data is shown here as Meta. Charts and tables carry meaning through direction, labels, and contrast rather than color alone.
Topics: cost per click Wicked Reports New Customer Acquisition Cost (NCAC) paid traffic attribution new customer conversion rate meta ads benchmark
1 min read
Every Platform Grades Its Own Homework : Scott on the ROAS Trap
I sat down with Aly Hathcock on her podcast Humans of Growth to unpack a problem every ecommerce marketer eventually runs into - the numbers on your dashboard keep improving, but the business isn't actually growing faster.
Topics: Podcast Wicked Reports ROI Return on Ad Spend (ROAS)
9 min read
The Paid Traffic Truth : The ROAS Trap Held a Second Week — and Got Wider
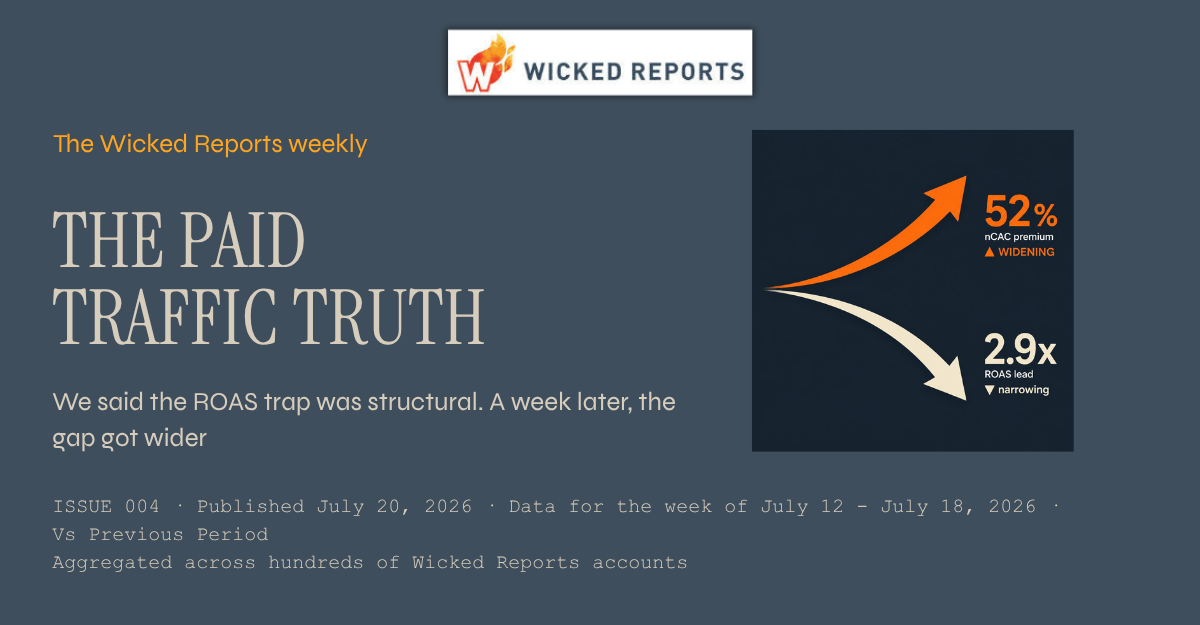
The Paid Traffic Truth — Issue 004
Published July 20,2026 * Data for the week of July 12 to July 18 2026 * Aggregated across hundreds of Wicked Reports accounts.
We said the ROAS trap was structural. A week later, the gap got wider
Last week I told you the ROAS trap was structural, not a July 4 hangover, and that it would look the same seven days later. It did. The only thing that changed is the gap got wider. Google's new customer went from 39% more expensive than Meta's to 52% more, while Google's ROAS lead over Meta actually shrank.
This week's number
Google's new customer cost 52% more than Meta's this week, up from 39% last week. In the same seven days, Google's ROAS lead over Meta narrowed from 3.1x to 2.9x. The two numbers are moving in opposite directions.
01 / Introduction
A follow up, because the data asked for one
Welcome to the fourth edition of the Paid Traffic Truth. Normally I bring you a new story each week. This week the data made me do something different and more useful. It let me check my own homework.
Last week's story was that ROAS ranks your channels backwards, because it fuses the cost of a new customer with the value of that customer and hides both. I said that pattern was structural, not a holiday artifact and that it would still be true after the July 4 noise cleared. This is the week that noise cleared. So let's see if it held. Every number below is first party and order verified, aggregated across hundreds of ecommerce brands.
02 / Analysis
It held. And the trap got more expensive.
Here is the honest test. If last week's ROAS trap were a July 4 mirage, this week it would soften. Search would stop looking artificially efficient, Meta would stop looking artificially weak, and the gap between reported ROAS and true new customer cost would close.
The opposite happened. Meta held the cheapest new customer in the set at $84, exactly where it was last week. Google's new customer climbed from $117 to $128. So the premium you pay for a new customer on Google, the channel that looks better on ROAS, went from 39% to 52% in one week. Microsoft, still the best ROAS in the set at 2.32, saw its new customer cost jump to $161, a 73% markup over its own blended number, up from 64%.
Sit with what that means for a budget decision. If you had watched the ROAS column last week and moved money toward Google, this week that channel's ROAS advantage got smaller and the price you paid for each new customer got bigger. You would have chased a lead that was closing while paying a premium that was rising. ROAS pointed you one way. The truth walked the other.
Here is the calendar check, because this report only works if I am honest about it. Last week you could have accused me of July 4 residue. This is the second full week clear of the holiday. The pattern did not fade, it sharpened. Two clean weeks, same direction, wider gap. That is the definition of structural. Search and Microsoft close demand and read high on ROAS. Meta prospects and reads low. It is not seasonal, and it will not fix itself.
03 / New Customer Acquisition
The full acquisition picture, by channel
Meta held its new customer cost flat at $84 and stayed the prospecting engine, with 90% of the customers it touched brand new. Google's cost rose while its new customer volume and conversion both slipped. That is the shape of the whole story in one row. The cheap acquisition channel held, the expensive one got more expensive. Pinterest ran on a tiny base again this week and carries an asterisk, so it is not anchoring anything.
04 / First Click vs Last Click
Who starts the sale vs who takes the bow
This is the engine under the trap, and it barely moved, which is the point. Last click, the model closest to what the platforms report, still inflates Google and Microsoft, the channels that close, and still shrinks Meta, the channel that opens. Meta gives back 0.14 of ROAS on last click. Microsoft gains 0.66. A rolling 90 day window does not swing on a holiday, and it did not. The credit is being handed to the closer, week in and week out.
05 / Overall Channel Performance
Where the money goes, and THE TRUE COST OF A NEW CUSTOMER
Meta and Google are again about 94% of tracked spend, so read those two rows together. Google's ROAS slipped from 1.59 to 1.43 while its new customer cost rose from $117 to $128. Both moved against you at once, and ROAS only showed you one of them. The markup column tells the same story it told last week, only louder. The gap between blended and true new customer cost is widest exactly where ROAS looks best. Microsoft's 73% markup is the cleanest example in the set.
06 / New Customer Lifetime Value
What a new customer becomes over a year
The value grid is the piece that keeps the story honest. Meta is the cheapest new customer to acquire and the lowest one year value at $97. Microsoft is the most expensive to acquire and the highest one year value at $365. This is why the answer is never simply buy Meta and cut Google. The point is that cost and value are two separate facts, and ROAS shows you neither. One caveat that always applies here. This blends hundreds of brands at different price points, so read it as a directional market benchmark, not a promise for your store.
07 / Conclusion
A pattern that survives a second week is a pattern you budget around
One week of a surprising number is a curiosity. Two clean weeks of the same number, moving further in the same direction, is a pattern. The ROAS trap is not a July 4 story and it is not going to correct itself, because it is built into how the models assign credit. The closer gets the bow. The opener gets cut.
You do not fix this with a better dashboard. You fix it with two verified numbers standing next to each other, the cost of a new customer and the value of that customer over time. Watch those instead of ROAS and the budget decision stops moving against you.
How this week's numbers were built. Aggregated across hundreds of Wicked Reports client accounts for the week of July 12 to July 18, 2026, except first click vs last click, which uses a rolling 90 day window. New versus repeat is verified at the order level against first party order IDs, not modeled and not surveyed. The new visit to new customer conversion rate credits the channel that originated the new visit. Channels without cost data, including email, SMS, organic, and influencer, are left out of the cost comparisons. Snapchat is excluded for negligible spend. Pinterest is marked with an asterisk because it ran on a small number of new customers this week, so it is not used to anchor any headline. The channel labeled Facebook in the underlying platform data is shown here as Meta. Charts and tables carry meaning through direction, labels, and contrast rather than color alone.
Topics: Wicked Reports customer lifetime value Google Ads Marketing Attribution New Customer Acquisition Cost (NCAC) Meta Ads paid traffic blended ROAS meta vs google ads paid media measurement
10 min read
The Paid Traffic Truth : Your best ROAS channel costs the most per new customer
.png)
The Paid Traffic Truth — Issue 003
Published July 13, 2026 · Data for the week of July 5 to July 11, 2026 · Aggregated across hundreds of Wicked Reports accounts
Rank your paid channels by ROAS and you get one order. Rank them by what a new customer actually costs and the order nearly flips. Google's ROAS is three times Meta's this week, and a new customer still costs 39% more on Google. If you move budget on ROAS alone, you are buying your most expensive customers on purpose.
This week's number
Google's blended ROAS is 3x Meta's. A new customer costs $117 on Google and $84 on Meta. The channel that looks most efficient is the priciest place to buy a customer.
01 / Introduction
One story, then the four grids
Welcome to the third edition of the Paid Traffic Truth. Every week I take one story from the world of paid traffic and break it down in the Analysis section, then hand you all four grids underneath it. New customer acquisition, first click vs last click, overall channel performance, and new customer lifetime value.
Every number comes from Wicked Reports first party new customer attribution and LTV, aggregated across hundreds of ecommerce brands and verified against real orders. These are the new customer numbers your ad platforms do not show you.
This week's featured story is the one that quietly reshuffles budgets every month. ROAS versus the true cost of a new customer.
02 / Analysis
ROAS ranks your channels backwards
Here is the trap. You open your dashboard, you sort by ROAS, and you make a decision. Microsoft is at 2.60. Google is at 1.59. Meta is sitting at 0.52 and looks like a problem. The obvious move is to pull from Meta and feed the winners.
Now sort the exact same channels by nCAC, the cost to acquire a brand new customer, verified against first order IDs. Meta is the cheapest in the set at $84. Google is $117. Microsoft is $141. The order you just trusted has flipped on its head.
So which sort is right. Both, and that is the point. ROAS is not lying to you. It is doing something worse. It is folding two very different numbers into one and hiding both.
Look at what ROAS is actually made of. Google closes a lot of demand that other channels created, so it books high revenue against its spend and posts a strong ROAS. Meta introduces people who have never heard of the brand, many of whom buy something small first, so it posts a low ROAS even while it is doing the hardest and most valuable job in the funnel, finding new humans.
The two numbers that ROAS smears together are cost and value. Split them apart and the fog clears. Cost is nCAC, what you pay to acquire a new customer. Value is nLTV, what that new customer becomes over the next year. This week Meta is the cheapest to acquire at $84 but the lowest one year value at $97. Microsoft is the most expensive to acquire at $141 but the highest one year value at $341. Neither of those facts survives inside a single ROAS number.
One honest note, because this report only works if the numbers are trustworthy. This is the week after the July 4 selling season, so conversion softened a little across most paid channels, the normal post holiday give back. But the story this week is not a calendar story. It is structural. Search and Microsoft close demand and read high on ROAS. Social and video prospect and read low. That pattern does not need a holiday to show up, and it will look the same next week. That is exactly why you cannot budget on ROAS alone.
03 / New Customer Acquisition
The full acquisition picture, by channel
Meta is carrying the prospecting load. It brought in more than 40,000 new customers this week, and89%of the customers it touched were brand new to the brand. That is the profile of a channel finding people, not milking a list. It is also the channel your dashboard told you to cut.
Conversion softened for most channels this week, the expected step down after the holiday selling week. YouTube was the exception, up 11%. Pinterest ran on a tiny base this week and is marked with an asterisk, so I am not using it to anchor anything.
04 / First Click vs Last Click
Who starts the sale vs who takes the bow
This grid is the mechanism behind the ROAS trap. Last click is the model closest to what the platforms report, and it inflates Google and Microsoft, the channels that close, while it shrinks Meta and Pinterest, the channels that open. Meta gives back 0.14 of ROAS on the last click. Microsoft gains 0.61. Judge a discovery channel on last click alone and you cut the thing that started the sale, then wonder why new customer growth stalled.
05 / Overall Channel Performance
Where the money goes, and THE TRUE COST OF A NEW CUSTOMER
Meta and Google are about 94% of tracked spend, so this is where the real decisions live. Put the ROAS column next to the nCAC column and read them together. Google's ROAS is roughly three times Meta's, and a new customer costs 39% more on Google. Microsoft posts the best ROAS in the set and the biggest gap between its blended and new customer cost, a 64% markup you never see if you only watch ROAS.
There is a second thing hiding in the aCAC column. On every paid channel the true new customer cost sits above the blended number, because blended quietly includes your existing customers coming back. It is widest exactly where ROAS looks best. That is not a coincidence. The channels that look most efficient are the ones leaning hardest on demand someone else created.
06 / New Customer Lifetime Value
What a new customer becomes over a year
This is the grid that finishes the story. Meta is the cheapest new customer to acquire and the lowest one year value at $97, a low order value high frequency profile. Microsoft is the most expensive to acquire and the highest one year value at $341. TikTok is expensive on day one but more than doubles its value by the one year mark, the strongest growth curve in the set.
Now the ROAS number makes sense, and it also makes clear why you should not trust it. Microsoft's strong ROAS is really a story about high value customers who close fast. Meta's weak ROAS is really a story about cheap acquisition of lower value customers who need time. Those are two completely different decisions, and ROAS gives you one blurry number for both. One caveat. This blends hundreds of brands at different price points, so read it as a directional market benchmark, not a promise for your store.
07 / Conclusion
Split the number, then decide
ROAS is not a business metric. It is an efficiency metric for a single platform, and it hides the two things you actually need to run acquisition, the cost of a new customer and the value of that customer over time. The channel that looks best on ROAS was the most expensive place to buy a customer this week. If you had moved budget on ROAS alone, you would have paid more to grow slower.
The fix is not a better dashboard. It is two verified numbers next to each other. What did a new customer cost, and what will that new customer become. Get those and the budget decision stops being a guess.
How this week's numbers were built. Aggregated across hundreds of Wicked Reports client accounts for the week of June 29 to July 5, 2026, except first click vs last click, which uses a rolling 90 day window. New versus repeat is verified at the order level against first party order IDs, not modeled and not surveyed. The new visit to new customer conversion rate credits the channel that originated the new visit. Channels without cost data, including email, SMS, organic, and influencer, are left out of the cost comparisons. Snapchat is excluded for negligible spend. Pinterest is marked with an asterisk because it ran on a small number of new customers this week, so it is not used to anchor any headline. The channel labeled Facebook in the underlying platform data is shown here as Meta. Charts and tables carry meaning through direction, labels, and contrast rather than color alone.
Topics: Wicked Reports customer lifetime value Google Ads Marketing Attribution New Customer Acquisition Cost (NCAC) Meta Ads paid traffic blended ROAS first click vs last click Paid Traffic Truth
8 min read
The Paid Traffic Truth : Meta's New Customer Conversion Just Jumped 66%
The Paid Traffic Truth — Issue 002
Published July 6, 2026 · Data for the week of June 29 to July 5, 2026 · Aggregated across hundreds of Wicked Reports accounts
In one week, Meta's new visit to new customer conversion rate rose 66%, its nCAC fell 38% to $81, and it drove 68% more new customers. This is the kind of move blended dashboards miss, and the reason this report exists.
This week's number
Meta's new visit to new customer conversion rate jumped 66% week over week, while its nCAC fell 38% to $81.
01 / INTRODUCTION
Welcome to the second edition of the Paid Traffic Truth. Every week I take one story from the world of paid traffic and break it down in the Analysis section, then hand you all four grids underneath it - new customer acquisition, first click vs last click, overall channel performance and new customer lifetime value. Every number comes from Wicked Reports first party new customer attribution and LTV, aggregated across hundreds of ecommerce brands and verified against real orders. These are the new customer numbers your ad platforms do not show you.
This week's featured story is the new visit to new customer conversion rate, and Meta owns it.
02 /Analysis
Meta turned more cold traffic into customers
First, what the metric means. A new visit is a page load from someone who has never been to your site before, ever. The new visit to new customer conversion rate is the share of those new visitors who go on to become first time customers.
Here is the part platforms get wrong and Wicked gets right. Wicked credits the channel that first brought the visitor in, even when the purchase happens later on a different channel. If your Meta ad drives a new visit and that person converts a week later through Google branded search, Meta still gets the conversion credit, because Meta found the new visitor who started the path.
Meta's new visit to new customer conversion rate improved 66% week over week, its nCAC dropped 38% to $81, and it brought in 68% more new customers than the week before. Conversion up, cost down, volume up, all at once, on the channel carrying the majority of tracked spend. TikTok moved the same direction at a smaller scale, up 33%, while YouTube slipped 19%.
One honest note, because this report only works if the numbers are trustworthy. This week contained the July 4th selling season, which pulls hesitant new visitors over the line across the whole market and the weekly figure counts same week orders, so a promo period naturally lifts conversion and lowers cost. Meta was also coming off a rough June. The fair read is a real rebound, helped by the holiday calendar. Either way, the movement is exactly the kind of signal a blended dashboard buries.
03 / New Customer Acquisition
The full acquisition picture, by channel
Meta's row tells the story, but notice the shape of the others. TikTok converted more new visits too. Google held flat on a huge base. YouTube gave some back. Direction matters more than any single week and this week the direction on new customer conversion was up for the channels that do the prospecting.
04 / First Click vs Last Click
Who starts the sale vs who takes the bow
The pattern barely moves week to week, which is the point. Microsoft and Google look strongest on the last click because they close, but the prospecting channels that introduce customers - Meta, Pinterest, TikTok, YouTube - all read higher on the first click. Judge a discovery channel on last click alone and you cut the thing that started the sale.
Meta and Google are about 93% of tracked spend. Look at the two cost columns side by side. On every channel the true new customer cost sits above the blended aCAC and it is widest on the search channels that look cheapest, Google at $69 blended against $105 for a new customer. Meta's blended cost fell 37% this week, which lines up with the strong new customer week in the Analysis.
06 / New Customer Lifetime Value
What a new customer becomes over a year
Microsoft and Google produce the most valuable new customers over a year, $337 and $212. Meta is cheap to acquire but the lowest one year value in the set at $97, a low AOV high frequency profile. TikTok roughly doubles a customer's value from first order to the one year mark. One caveat. This blends hundreds of brands at different price points, so read it as a directional benchmark for the market, not a promise for your store.
07 / Conclusion
Measure new versus repeat, then decide
Meta had a genuinely strong new customer week, and a blended dashboard would have shown you almost none of it. That is the whole reason for this report. Every week, verified new customer numbers across every channel, so you can see what is actually working before you move budget.
See your own VERSION OF THESE four grids
Your real nCAC next to your aCAC, your first versus last click gap, your new customer LTV by channel, in your own account.
How this week's numbers were built. Aggregated across hundreds of Wicked Reports client accounts for the week of June 29 to July 5, 2026, except first click vs last click, which uses a rolling 90 day window. New versus repeat is verified at the order level against first party order IDs, not modeled and not surveyed. The new visit to new customer conversion rate credits the channel that originated the new visit. Channels without cost data, including email, SMS, organic, and influencer, are left out of the cost comparisons. Snapchat is excluded for negligible spend. Pinterest is marked with an asterisk because it ran on a small number of new customers this week, so it is not used to anchor any headline. The channel labeled Facebook in the underlying platform data is shown here as Meta. Charts and tables carry meaning through direction, labels, and contrast rather than color alone.
Topics: Wicked Reports customer lifetime value Marketing Attribution New Customer Acquisition Cost (NCAC) Meta Ads paid traffic blended ROAS first click vs last click Paid Traffic Truth
8 min read
The Paid Traffic Truth : The New Customer Markup Your Dashboard Hides
The Paid Traffic Truth — Issue 001
The Wicked Reports Weekly · Week of Jun 21–27 2026 · Verified first-party order data · vs previous period
Across every paid channel this week, a new customer cost 20% to 60% more than your blended CAC. If your acquisition goal was built on that blended number, you are quietly starving top of funnel.
01 / INTRODUCTION
Welcome to the first edition of the Paid Traffic Truth report. Every week I feature one story from the world of paid traffic in the Analysis section, then give you all four grids underneath it - new customer acquisition, first click vs last click, overall channel performance, and new customer lifetime value. All of it comes from Wicked Reports top of funnel new customer attribution and LTV, aggregated across hundreds of client accounts and verified against real orders.
This week's featured story is nCAC vs aCAC, channel by channel.
02 /Analysis
New customers cost more than your dashboard says
This week's story is the gap between two numbers that look almost the same and are not.
nCAC = cost to acquire a new customer.
aCAC = cost to acquire any customer.
All new versus any customer data is validated against first party order IDs.
The cost to acquire a new customer this week ran $20 to $55 higher than the cost to acquire any customer. And that any customer number includes your existing customers coming back to repurchase, which is exactly why it looks cheaper than it is.
Microsoft is the sharpest example. On a blended basis a customer looks like $86. A brand new one actually costs $141, a 64% markup you never see if you only watch blended CAC. Google tells the same story at the biggest spend level in the set, $74 blended against $105 for a new customer.
Factor that markup into your nCAC goals. Start with your aCAC, spend divided by total customers. Then add at least 20% to reach a realistic new customer cost, and if you lean on search, assume a lot more. The gap this week ran from about 20% at the low end to more than 60% on Microsoft.
Now the part that quietly costs brands their growth. I see this happen constantly. Spend gets cut at top of funnel because it does not hit a CAC goal. But that goal's foundation included repeat purchasers. So you get a hamster wheel. You cut spend at TOF, you see great numbers in Meta or Google or wherever, and your bottom line new customer growth stalls.
Realistic nCAC goals are the place to start fixing that.
03 / New Customer Acquisition
nCAC vs aCAC, every paid channel
A high nCAC is only a problem if the customer never returns. New-customer value at 30, 90, 180, and 365 days tells you which expensive channels are actually your best ones.
The orange bar sits above the light bar on every single channel. The two that look cheapest on a blended basis, Google at $74 and Microsoft at $86, carry the widest jump to their true new customer cost. Cheap looking is not the same as cheap.
04 / First Click vs Last Click
Who starts the sale vs who takes the bow
Microsoft and Google post the strongest last click ROAS because they are usually the final step before a purchase. But the prospecting channels that introduce customers, Facebook, Pinterest, TikTok, YouTube, all read higher on first click than last, so a positive credit gap means last click is taking credit and a negative one means last click is giving it away. Judge a discovery channel on last click alone and you cut the thing that started the sale. More on this gap in a future edition.
Two channels own this market. Facebook is 56% of tracked spend and Google another 37%, so about nine dollars in ten flow through Meta and Google. aCAC came down on most channels this week, and Facebook's average order value fell 41%, which at this scale reads as calendar and mix rather than a change in behavior. Read the direction of the trend, not any single week in isolation.
06 / New Customer Lifetime Value
What a new customer becomes over a year
Microsoft and Google produce the most valuable new customers over a year, $324 and $215, and both clear their new customer CAC comfortably. The prospecting channels tell a growth story of their own. A new TikTok customer is worth about 2.3 times their first order value by the one year mark, Pinterest about 1.9 times. Facebook is the mirror image, cheap to acquire but the lowest one year value in the set at $111, a low AOV high frequency profile. One honest caveat. This blends hundreds of brands at different price points, so read it as a directional benchmark for the market, not a promise for your specific store.
07 / Conclusion
Measure new versus repeat, then decide
The thread through all four grids is the same. The numbers your ad platforms and your dashboard hand you, blended CAC, last click ROAS, a single week's ROAS, all flatter the channels that close and hide what a new customer truly costs and returns. Measure new versus repeat at the order level and the picture changes, sometimes enough to change where your next dollar goes.
See your own four grids
Your real nCAC next to your aCAC, your first versus last click gap, your new customer LTV by channel, in your own account.
How this week's numbers were built. Aggregated across hundreds of Wicked Reports client accounts for the week of June 21 to 27, 2026, except first click vs last click, which uses a rolling 90 day window. New versus repeat is verified at the order level against first party order IDs, not modeled and not surveyed. aCAC is spend divided by all customers. nCAC is spend divided by verified first time customers. Channels without cost data, including email, SMS, organic, and influencer, are left out of the CAC comparison and the chart. Charts and tables separate series by light and dark contrast, direct labels, and direction glyphs rather than color alone.
Topics: Google Ads Marketing Attribution New Customer Acquisition Cost (NCAC) Meta Ads eCommerce Marketing Attribution paid traffic paid media benchmarks DTC marketing TikTok ads
3 min read
Why Agencies Shouldn't Fear the Numbers
-3.png)
Why Agencies Need Third-Party Attribution
Every platform grades its own homework, and Meta's ad manager is no exception. For agencies, that usually feels like a good thing. A 5x ROAS is an easy story to tell a client. It stays a good thing right up until the client's blended ROAS goes flat and they start asking why the business is not growing if everything is "performing."
That gap has a name: the doubt gap. You are reporting wins. The client is watching revenue sit still. That is the moment they start looking for a new agency, not because you did bad work, but because nobody could tell them the truth about which ads actually brought in a new customer. ROAS tells you what the platform wants you to know. New customer acquisition cost tells you what it actually cost to get someone new.
We watched one agency's client go from paying $116 for a new customer down to $69 in 30 days, not by spending more, but by finally seeing which channels were buying attention versus buying customers. That is the number that keeps a retainer. Not ROAS.
Wicked Reports does not add another dashboard to the pile. Every week, the Decision Log tells you, in writing and with a dollar figure attached, which campaigns to scale, which to chill, and which to kill. You are not interpreting a chart. You are pointing your client at a decision that has already been made from their own first-party order data.
The agencies that get ahead of this stop being the ones reporting the numbers and start being the ones the client trusts to explain them. That is the whole shift, from vendor to guide. Ready to stop grading your own homework? Book a demo with Wicked Reports.
Topics: Wicked Reports Marketing Attribution New Customer Acquisition Cost (NCAC) client retention DTC marketing blended ROAS agency reporting
6 min read
Your Data Is Being Estimated — And Nobody Told You
Your Data Is Being Estimated — And Nobody Told You
Two things happened this week that every DTC brand running paid media needs to understand. Both are quiet. Neither comes with an alert in your dashboard. And together they explain why your attribution numbers are getting less trustworthy at the exact moment your platforms are making them look more complete.
Topics: Wicked Reports • Aggregated Event Measurement • CAPI deduplication • Marketing attribution accuracy • Conversions API
5 min read
Three Attribution Shifts Every DTC Brand Should Know
-Aug-21-2026-08-48-11-4729-AM.png)
Three Attribution Shifts That Change What Your Reports Mean
Three changes landed in 2026 that quietly altered what your ad platforms report, and each one can make your numbers move without your actual business changing at all. If you do not know they happened, you will misread a reporting change as a performance change, and make budget decisions on the difference. Here is what shifted, and what each one means for how you read your revenue.
Topics: Wicked Reports New Customer Acquisition Cost (NCAC) marketing attribution 2026 ad tracking 2026 MTA vs MMM
14 min read
How Meta, Google, and TikTok Changed Your Numbers Without Telling You
-Aug-06-2026-08-12-43-6646-AM.png)
How Meta, Google, and TikTok Changed Your Numbers Without Telling You
What Changed, What It Means, and What to Watch in June
Topics: Wicked Reports Marketing Efficiency Ratio GA4 attribution restructure AI Max for Shopping TikTok Attribution Portfolio
6 min read
Meta Is Now Charging to Reach Your Customers
-Aug-17-2026-09-35-26-1602-AM.png)
Meta Is Now Charging to Reach Your Customers: What It Actually Costs You
There has been a lot of noise about Meta's paid ad-free subscription tier. Let me cut through it and tell you what is actually happening, and more importantly, what it means for every dollar you are spending on paid ads right now.
Topics: Wicked Reports Ecommerce Attribution Meta ad-free ecommerce impact Meta subscriptions attribution CPM increase 2026 meta roas
12 min read
How Link Necklaces Cut Meta nCAC 22% and Nearly Doubled New Customers
-Aug-06-2026-08-18-06-9170-AM.png)
How to Reduce Meta nCAC for Ecommerce : The Link Necklaces Case Study
Every Q4, the same trap closes on DTC brands running performance media: the platform dashboards look healthy, ROAS is holding, and then the post-mortem reveals that most of the "new customer" budget went to people who already bought.
Topics: ecommerce attribution case study How to reduce Meta nCAC New customer acquisition Meta why Meta ROAS doesn't show new customers Triple Whale alternative
8 min read
How to Track ChatGPT Ads the Right Way
-Aug-06-2026-08-24-54-6670-AM.png)
How to Track ChatGPT Ads (And Why Your Current Setup Is Already Lying to You)
ChatGPT just became an ad platform.
High-intent users. Contextual placement. Buyers in research mode asking questions your ads can actually answer.
If you're a performance marketer, you're already thinking about it.
Here's the problem nobody's talking about : the way you currently track ads wasn't built for this. Plug ChatGPT ad spend into your existing GA4 and Meta setup and you'll get confident-looking numbers that are almost certainly wrong.
Same flawed attribution. New channel. Faster budget burn.
I cover what actually breaks when you try to track ChatGPT ads, and how to set it up so the data underneath is finally honest.
Topics: Wicked Reports multi-touch attribution Marketing Attribution ChatGPT ads tracking ChatGPT advertising attribution how to track ChatGPT ads ad spend tracking UTM parameters ChatGPT
9 min read
Why Meta CPA Understates New Customer Acquisition Cost
-2.png)
Why Your Meta CPA Is Lying to You
Meta's platform reports a healthy cost per acquisition. Meanwhile, your new customer count is flat. That is not a coincidence, it is a measurement problem. There is an attribution gap hiding inside your ad account, and once you can see it, you can fix it. Here is what it is, how to find it, and what to measure instead.
Topics: Wicked Reports Meta Advantage Plus Campaign Analysis Marketing Attribution New Customer Acquisition Cost (NCAC) Meta Ads Waste
3 min read
The Monday Routine That Stops Wasted Ad Spend : The Five Forces Playbook
-4.png)
The Monday Routine That Stops Wasted Ad Spend: The Five Forces Playbook
If your team spends Mondays arguing over dashboards and guessing what to optimize, it’s time for a change. The Five Forces Playbook turns data into decisions with a simple, repeatable weekly routine.
Topics: Wicked Reports Five Forces Methodology Ad Spend Management Marketing Workflow Team Accountability Scaling Strategy
3 min read
How the Optimization Force Improves Campaign Performance
-4.png)
How the Optimization Force Improves Campaign Performance
Most “optimization” is random. Marketers tweak campaigns, launch new creative, or shuffle budgets hoping for better performance. But hope isn’t a strategy.
Topics: Wicked Reports marketing ROI Five Forces Methodology Optimization Force Campaign Management Ad Strategy
7 min read
The Attribution Lie: Why Your Best Campaigns May Fail You
-Aug-20-2026-09-27-27-2364-AM.png)
The Attribution Lie: Why Your Best Campaigns May Be Failing You
There is a particular kind of expensive mistake that is almost impossible to see from inside a platform dashboard. It looks exactly like success. The ROAS is strong, conversion volume is solid, your campaigns hit their efficiency targets, and every month you confidently pour more budget into the channels that are "working." The problem is they are not working. They are claiming credit for work done somewhere else. I call these Attribution Lies, and once you learn to spot them, you cannot unsee them.
Topics: Wicked Reports Marketing Attribution New Customer Acquisition Cost (NCAC) true new-customer ROAS marketing measurement Ad Attribution
5 min read
Why High ROAS Isn’t Enough : Scaling with the Outcome Force
-4.png)
Why High ROAS Isn't Enough: Scaling with the Outcome Force
Here’s a scary truth for eCommerce operators: you can have great ROAS and still be wasting money. Many campaigns look profitable in-platform, but in reality, they’re recycling customers you already have, giving you an inflated sense of performance.
Topics: Wicked Reports Marketing Attribution ad spend optimization Five Forces Methodology Outcome Force Scaling Growth
10 min read
The Retargeting Trap: How Tier 11 Cut nCAC 34% (Case Study)
-2.png)
A real conversation with the Tier 11 team about what happens when the scoreboard is wrong — and what it costs you every single month.
Topics: Wicked Reports Digital Marketing Insights New Customer Acquisition Cost (NCAC) marketing_attribution_platform fix ROAS nmer
5 min read
Data Isn’t Power — Action Is
-3.png)
Data Isn't Power — Action Is
If your data doesn’t change your behavior, it’s decoration. Here’s how the Action force turns attribution into execution.
From data to decisions
Metrics alone don’t grow your business. If your data doesn’t change your behavior, it’s just decoration.
Topics: Wicked Reports Decision Making Five Forces Methodology Ad Attribution Data Analytics Meta Ads Optimization
6 min read
Are Your Campaigns Failing — Or Are You Just Measuring Too Soon?
-2.png)
Are Your Campaigns Failing — Or Are You Just Measuring Too Soon?
The Expectation force fixes false negatives, aligns your Northstar KPIs, and gives you confidence in your ad spend.
Topics: Wicked Reports Marketing Attribution Data-Driven Decisions eCommerce Operations Measurement Windows
7 min read
Why Your Best ROAS Campaign Might Be Hiding Your Growth Problem
-2.png)
Why Your Best ROAS Campaign Might Be Hiding Your Growth Problem
Align campaign intention with the right metric — and finally make dashboards mean something.
Topics: Wicked Reports Marketing Attribution ROAS vs ROI new customer acquisition Performance Marketing Strategy Campaign Intention
4 min read
Marketing Success Isn’t Luck — It’s a System
-2.png)
Marketing Success Isn't Luck — It's a System
Introducing the Five Forces that turn marketing data into predictable, profitable growth.
Topics: Wicked Reports performance marketing Data-Driven Marketing eCommerce Strategy Scaling Shopify Five Forces Methodology
11 min read
Attribution Isn’t Your Problem. Decisions Are.
-1.png)
Attribution Isn't Your Problem. Decisions Are.
Teams stare at dashboards every day. They debate numbers. They argue attribution. They wait. And while they wait, money leaks out of the account. Not because they’re running obvious losers — but because they’re letting quiet losers linger for weeks.
Topics: Wicked Reports Marketing Analytics Customer Acquisition Scaling Paid Media Ad Optimization Marketing Operations
5 min read
Meta Customer Acquisition 2026 : Signal Architecture
-Aug-17-2026-08-59-16-3365-AM.png)
Meta Customer Acquisition in 2026: Signal Architecture, Not Audiences
The Meta acquisition game has changed, and if you are still trying to win it with audience hacks, you are already behind. Meta's algorithm is now better at finding audiences than any media buyer. The real leverage in 2026 is not who you target, it is what you teach the algorithm to value. That is signal architecture: the system that tells Meta what success actually looks like for your business, instead of letting it optimize for whatever is easiest to convert. Get it right and you escape the retargeting trap, lower new customer acquisition cost, and build repeatable growth instead of volatile performance. Here is the 2026 acquisition stack that is working right now.
Topics: Wicked Reports meta signal architecture meta retargeting trap meta customer acquisition meta ads optimization 2026
4 min read
Why ROAS Alone Is Hurting Your Marketing Growth
-2.png)
Why One KPI Is Breaking Your Marketing (And What to Do Instead)
Most marketing teams are obsessed with one question: how are we doing? It sounds reasonable. It is also one of the fastest ways to stall your growth, because "doing" what, exactly? When an entire company rallies around a single KPI, and that KPI is almost always ROAS, you create one behavior: optimize the bottom of the funnel forever. And that is how growth quietly dies.
Topics: Wicked Reports roas Marketing Attribution Marketing KPIs growth marketing new customer acquisition
4 min read
Why 7-Day Attribution is Killing Your 2026 New Customer Acquisition
-1.png)
Why 7-Day Attribution is Killing Your 2026 New Customer Acquisition
Short attribution windows undercount top-of-funnel success and train marketers to cut profitable long-term campaigns. To scale in 2026, brands must measure "Delayed Profit" using cohort lifetime value.
Topics: Wicked Reports performance marketing Top of Funnel Attribution Modeling Marketing Data Customer Consideration Cycle
5 min read
Why View-Through Conversions Are Dangerous for Your Ad Budget
-1.png)
Why View-Through Conversions Are Dangerous for Your Ad Budget
It’s a bold statement, but if you’ve ever seen your in-platform ROAS skyrocket while your bank balance stays flat, you know it’s the truth. At Wicked Reports, we see it all the time: platforms using view-throughs to manufacture confidence where there is none.
Topics: Wicked Reports view-through conversions First-Party Data marketing ROI Ad Platform Transparency Click-Based Attribution
5 min read
Diagnosing Rising nCAC: Why Your Offer Might Not Be the Problem
-1.png)
Diagnosing Rising nCAC: Why Your Offer Might Not Be the Problem
When your paid media costs start creeping up, the natural reaction is to panic. Most founders and agencies immediately start "thrashing"—changing the offer, the landing page, the product bundles, and the creative.
Topics: Wicked Reports Marketing Attribution New Customer Acquisition Cost (NCAC) ad spend optimization Top of Funnel Data Accuracy
5 min read
Meta Advantage+ Isn’t Broken, But Your Reward Signal Is
-1.png)
Meta Advantage+ Isn’t Broken, But Your "Reward Signal" Is
Many eCommerce founders feel like Meta Advantage+ is a "black box" that works for a while and then suddenly hits a wall. You see the purchases coming in, but your new customer growth has flatlined.
Topics: Wicked Reports New Customer Acquisition Cost (NCAC) Meta Advantage+ eCommerce Scaling Ad Signal Architecture Retargeting Trap
5 min read
Setting the Intention : How the 5 Forces Automates Your Marketing Decisions
SETTING THE INTENTION : HOW THE 5 FORCES AUTOMATES YOUR MARKETING DECISIONS
For years, getting a real edge in ecommerce meant having the best data scientists or the most elaborate spreadsheets. You mined dashboards by hand, hunting for the signal in the noise. But manual data mining is slow, and in paid advertising, slow is expensive. The answer is not to hand your decisions to a black-box algorithm that guesses. It is to automate them with a system that computes the answer from your real data and shows you the math. That distinction, deterministic not generative, is the whole point.
Topics: Wicked Reports nCAC Marketing Automation AI in Marketing 5 Forces Methodology Ad Scaling Strategy
4 min read
Repairing the Data Loop : Unlock Meta's Real Performance
-4.png)
Repairing the Data Loop: How to Unlock Meta's Real Performance
For years, Meta was the gold standard for customer acquisition. Then iOS privacy changes landed, and a lot of advertisers feel like the magic disappeared. Here is the reframe that matters: the algorithm did not lose its power, it lost its sight. Meta's AI is still extraordinary at finding customers. It just cannot see which ones actually bought anymore, so it optimizes toward the wrong signals. To get brilliant performance back, you do not need a new hack. You need to repair your data loop.
Topics: Wicked Reports Attribution Health Customer Acquisition Cost (CAC) vs NCAC Meta Ads E-commerce Strategy
4 min read
The ROAS Trap: Why Efficient Ads Are Killing Your eCommerce Growth
-1.png)
Meta Advantage+ Isn't Broken, But Your Reward Signal Is
You’ve seen the screenshots. A 5x, 8x, maybe even a 10x ROAS inside the Meta Ads Manager. On paper, you’re winning. But when you look at your bank account or your total business revenue, the needle isn't moving.
Topics: Wicked Reports Marketing Attribution New Customer Acquisition Cost (NCAC) Meta Ads eCommerce Strategy
4 min read
The North Star Strategy: Proving Agency Impact via Attribution
-Aug-10-2026-08-25-38-2371-AM.png)
The North Star Strategy: How Agencies Prove Impact with Customer Level Attribution
In the competitive landscape of digital marketing, agencies are often judged by metrics they can’t fully control. Platform ROAS is increasingly unreliable, and "blended" metrics often hide the truth about where growth is actually coming from.
Topics: Wicked Reports New Customer Acquisition Cost (NCAC) marketing ROI digital marketing agency customer level attribution client retention
5 min read
High Meta ROAS but Flat Revenue? Here's Why
-2.png)
Why Your Meta ROAS Is High but Your Revenue Is Flat
Every week, marketing teams celebrate winning campaigns in Meta Ads Manager. And every week, a few days later, the CFO asks the question that deflates the room: if the ads are doing so well, why has total revenue not moved? That gap between a great-looking dashboard and flat actual revenue is one of the most common and most expensive problems in DTC. It happens because Meta's definition of success is not the same as yours.
Topics: Wicked Reports Meta Ads ecommerce marketing ROAS Optimization Ad Spend ROI marketing attribution solutions
5 min read
How CBazaar Acquired 127% More New Customers on Meta While Spending 17% Less
-Aug-10-2026-08-58-06-3462-AM.png)
HOW CBAZAAR ACQUIRED 127% MORE NEW CUSTOMERS ON META WHILE SPENDING 17% LESS
In high-ticket, low-frequency industries like wedding and occasion fashion, the traditional funnel is broken. You cannot rely on repeat purchases to rescue a high acquisition cost, because customers only buy a few outfits in a lifetime. You have to win the new customer on Meta, profitably, and prove it. Here is how CBazaar did exactly that.
Topics: Wicked Reports Meta Ads ecommerce marketing strategy Customer Acquisition Wicked Reports Case Study
5 min read
Drowning in Dashboards? Why You Need Better Decisions, Not More Data
-Aug-10-2026-09-27-19-1159-AM.png)
DROWNING IN DASHBOARDS? WHY YOU NEED BETTER DECISIONS, NOT MORE DATA
WHAT IS THE DIFFERENCE BETWEEN MARKETING REPORTING AND MARKETING DECISIONING?
Reporting simply displays data, the charts and ROAS numbers. Decisioning translates that data into a definite action: scale, chill, or kill. Most brands hit a growth bottleneck because they spend more time debating whether the data is accurate than actually making budget decisions. 5 Forces AI closes that gap by analyzing 238 core data points and returning daily budget and creative recommendations, each computed from your own numbers with the reasoning shown.
Topics: Wicked Reports 5 Forces AI data overload marketing bottlenecks scale chill kill tactical guidance attribution AI e-commerce scaling
4 min read
The Most Important Metric in Your Business (and Why You Aren’t Tracking it Correctly)
-4.png)
THE MOST IMPORTANT METRIC IN YOUR BUSINESS (AND WHY YOU AREN'T TRACKING IT CORRECTLY)
WHAT IS THE MOST IMPORTANT METRIC FOR ECOMMERCE SCALING?
The critical metric for predictable growth is nCAC to nLTV payback, new customer acquisition cost measured against new customer lifetime value payback. Unlike standard ROAS, this metric calculates how long it takes for a first-time customer to repay their acquisition cost, so you can scale spend based on cash flow and long-term profitability rather than platform vibes.
In ecommerce, everyone tracks ROAS and standard CAC. Those are necessary, but they are lagging metrics. They tell you what already happened, not whether you can afford to double your budget tomorrow. Scaling is a gamble until you know your nCAC to nLTV payback. This equation turns marketing spend from a cost center into a predictable growth engine.
Topics: Wicked Reports New Customer Acquisition Cost (NCAC) nLTV nCAC Payback LTV Payback profitable scaling
4 min read
3 Mistakes Killing Your Top-of-Funnel Performance
-Aug-20-2026-08-45-44-1449-AM.png)
The 3 Mistakes Killing Your Top-of-Funnel Performance
Top-of-funnel is where you introduce your brand to new, high-potential customers. It is the lifeblood of sustainable growth, and it is also where even sophisticated brands quietly sabotage themselves without realizing it. If your top-line revenue has stalled or your new customer acquisition cost is creeping up, the cause is usually one of three top-of-funnel mistakes. Here they are, and how to fix each.
Topics: Wicked Reports New Customer Acquisition Cost (NCAC) Top of Funnel TOF attribution
4 min read
The Fastest Path to Lower nCAC : Fix the Meta Signal
-Aug-21-2026-07-22-08-7596-AM.png)
The Fastest Path to Lower nCAC : Fix the Meta Signal, Not the Creatives
If you want to lower your new customer acquisition cost on Meta, the fastest lever is not more creative. It is fixing the signal you send the algorithm. Most brands attack high nCAC with more hooks, more ad variations, and elaborate testing systems. That is treating a symptom. The real problem is usually what the algorithm is being told to optimize for, and fixing that is faster and more impactful than weeks of creative testing.
Topics: Wicked Reports Attribution Software New Customer CAC lower nCAC Meta signal fix Meta ads efficiency Marketing Optimization
5 min read
The Growth Ceiling Trap : Why Meta Rewards Wrong Campaigns
-Aug-21-2026-07-32-26-5469-AM.png)
The Growth Ceiling Trap : Why Meta Rewards the Wrong Campaigns
You scaled to $3M, then $10M, maybe $30M, and then it stopped. You pushed out more creative, you raised the budget, and new customer acquisition stayed flat anyway. This is the growth ceiling trap, and it is one of the most common and most misunderstood plateaus in DTC. The frustrating part is that your dashboards still look fine while it happens. The cause is not your creative or your spend. It is a systemic bias in how Meta optimizes, and until you fix it, more budget just buys more of the same stall.
Topics: Wicked Reports Advanced Signal New Customer Acquisition Cost (NCAC) Ad Platform ROAS Meta Bias Growth Ceiling Retargeting Waste
4 min read
Stop Wasting 40% of Ad Spend on Existing Customers
-Aug-19-2026-09-04-23-3272-AM.png)
Stop Wasting 40% of Your Ad Spend on Customers You Already Own
Here is an uncomfortable possibility most brands never check: a large share of your Meta ad budget, often a third to a half of it, may be going toward reaching customers you already own. Meta reports those repurchases as conversions, your ROAS looks healthy, and the whole time your actual new-customer growth is flat. You are paying to reacquire people who were going to buy anyway, and calling it acquisition. Here is why it happens and how to stop it.
Topics: Wicked Reports Advanced Signal Meta Ads Waste New Customer CAC eCommerce Ad Strategy Inflated ROAS
4 min read
The Hidden Cost of Bad Attribution : Quantify the Risk
-Aug-21-2026-07-41-48-1235-AM.png)
The Hidden Cost of Bad Attribution : How to Quantify the Risk
Founders and marketing leaders spend a lot of energy fighting external costs, rising CPMs, more expensive clicks, tougher competition. But the most destructive cost in most ad accounts is internal and almost invisible: bad attribution. When you make high-stakes budget decisions on biased or misleading data, you scale the wrong campaigns and quietly drain profit, and it does not show up as a line item anywhere. Here is how to see that hidden cost, and how to put a number on it.
Topics: Wicked Reports Wasted Ad Spend Marketing Attribution Cost Marketing Calculator Attribution Value ROAS Calculation Top of Funnel ROI
4 min read
The Retargeting Trap: More New Customers on Half the Spend
-2.png)
The Retargeting Trap : How OneCore Media Got SweetLegs More New Customers on Half the Spend
WHAT IS THE RETARGETING TRAP?
The retargeting trap is a marketing failure where brands unknowingly spend their budget re-acquiring existing customers instead of finding new ones. It creates a treacherous paradox: platform ROAS looks high, often 6x to 10x, while actual new customer growth stays flat. Using FunnelVision to audit their retargeting loops, the agency OneCore Media helped its client SweetLegs generate more revenue and more new customers on roughly half the ad spend. Here is how.
Topics: Wicked Reports funnelVision Marketing Attribution New Customer Acquisition Cost (NCAC) e-commerce growth retargeting loop
5 min read
What Wicked Reports Does : 5 Forces AI, Advanced Signal & More
-3.png)
What Wicked Reports Does : The System Behind Better Budget Decisions
WHAT DOES WICKED REPORTS ACTUALLY DO?
Wicked Reports replaces revenue illusions with a faster, clearer decision system. It reconciles every channel against your real orders, then turns that into scale, chill, kill decisions you can act on. The core capabilities are 5 Forces AI for deterministic recommendations, Advanced Signal for training Meta on new customers, FunnelVision with infinite lookback for the full journey, and localized reporting so global teams decide on proof, not vibes. Here is how each one works.
Topics: Wicked Reports funnelVision Marketing Attribution Data Reporting 5 Forces AI Profitability Analysis
4 min read
The Direct Conversion Black Hole : 40% Untracked Revenue
-Aug-21-2026-07-12-26-9755-AM.png)
The Direct Conversion Black Hole : Why 40% of Your Revenue Is Untracked
Open your Shopify or GA4 dashboard and look at your "Direct" channel. If it is showing 30 percent or higher, you are probably losing the trail on a large share of your revenue, and it is costing you more than you think. It is tempting to read a big Direct number as a sign your brand is so strong that people just type in your URL. Unless you are a household name, that is a comforting fantasy. Marketing drove most of those sales. You just cannot see which marketing, and that blind spot has a name: the Direct Conversion Black Hole.
Topics: Wicked Reports Attribution Black Hole Shopify Attribution Top of Funnel ROAS GA4 Direct Traffic Direct Conversion Gap
4 min read
Infinite Lookback : Why 7-Day Cookies Kill Ecommerce Growth
-3.png)
Infinite Lookback : Why a 7-Day Cookie Is Killing Your Ecommerce Growth
When you look at your marketing attribution dashboard, do you feel a surge of confidence or a chill of doubt?
If you rely on the industry-standard 7-day cookie for tracking, that doubt is justified. You might be celebrating short-term wins while the true drivers of your growth, the clicks that started the entire customer journey, fly completely under the radar.
At Wicked Reports we built our solution around infinite lookback for exactly this reason.
Topics: Wicked Reports customer journey Marketing Attribution E-commerce Attribution 7-Day Cookie Eternal Tracking
6 min read
How Huha Scaled from $1M to $30M with True Attribution
-Aug-13-2026-08-45-43-7528-AM.png)
How Huha Scaled from $1M Toward $30M by Escaping the 8-Figure Attribution Trap
Most brands do not stall at eight figures because they run out of demand. They stall because they can no longer tell which marketing is actually driving growth. At $1M in revenue you can feel your way forward. At scale, feeling your way forward is how you set fire to a budget. This is the story of how the agency Magic vs Machine scaled Huha from roughly $1M to $23M and counting, on track toward $30M, bootstrapped, by fixing the one thing that breaks at scale: knowing what actually works.
Topics: Wicked Reports Shopify Meta Ads Huha Advantage+ Shopping Campaigns Magic vs Machine
6 min read
Last-Click Attribution for Ecommerce : When to Use It
-1.png)
LAST-CLICK ATTRIBUTION FOR ECOMMERCE : WHEN TO USE IT AND WHEN IT LIES TO YOU
Last-click attribution is the most widely used model in ecommerce, and also the most widely misunderstood. It is not useless, and it is not evil. It is a narrow lens that is genuinely useful for some questions and dangerously misleading for others. The problem is that most platforms default to it, so most marketers end up making broad budget decisions through a lens built for a much smaller job. Here is what last-click actually does, when it is fine to rely on, and when it will quietly lead you to spend in the wrong places.
Topics: Wicked Reports attribution models Marketing Attribution last click attribution eCommerce Marketing Attribution
6 min read
Facebook Ads vs. Google Ads in 2026: Which One Actually Deserves Your Next Dollar?
-1.png)
If you're running paid on both Meta and Google — or deciding where to put your next budget increase — you've probably noticed the two platforms behave nothing alike.
Topics: Wicked Reports Facebook ads Google Ads Paid Social Media eCommerce Advertising ad platforms comparison paid search machine learning ads
6 min read
First-Click Attribution: When the First Touch Wins
.png)
FIRST-CLICK ATTRIBUTION: WHEN THE FIRST TOUCH IS THE ONE THAT MATTERS
Most attribution debates obsess over the last click — who closed the sale. But for any brand that lives or dies on acquiring new customers from cold traffic, there's a more important question the last click can't answer - what actually made this person aware of you in the first place? That's what first-click attribution is for. Here's when it's the right lens, when it isn't and why it's the natural counterpart to last-click in a complete measurement picture.
Topics: Wicked Reports attribution models Cold Traffic Measurement first click vs last click demand generation
5 min read
Pinterest Attribution : Track Real Pinterest Ad ROI
-3.png)
PINTEREST ATTRIBUTION : HOW TO TRACK THE REAL ROI OF A SLOW-BURN CHANNEL
Pinterest is one of the most misjudged channels in ecommerce advertising, and the reason is timing. Pinterest users are often in the research and inspiration phase, saving ideas and planning purchases they will make weeks or months later. That makes Pinterest a powerful demand-creation channel, and it also makes it one of the easiest channels to undervalue, because the sale it started often closes much later through another touch. If you judge Pinterest on last-click or a short platform window, you will almost certainly underrate it. Here is how to track the real ROI of your Pinterest ads.
Topics: Wicked Reports Marketing Attribution Pinterest Ads ROI buying cycle pinterest
5 min read
Meta Advantage+ vs Manual : 55,661 Campaigns Analyzed
-3.png)
Meta Is Pushing Advantage+ Campaigns Relentlessly. Here's What 55,661 Campaigns Reveal.
The promise of Andromeda's AI brain sorting through a billion users to find your customers on auto-pilot sounds quite enticing. But I could not help wondering: is this actually a good thing for brands?
I ask because I have spent 10 years tracking Meta campaign performance against actual orders, and four things have stayed true the entire time.
Meta overstates its ability to drive immediate bottom-of-funnel sales.
Meta understates its ability to drive top-of-funnel cold traffic that leads to new customers.
Meta shows a lot more ROAS when you widen the attribution time window.
Meta's Conversions API is heavily optimized for immediate sales on the default setup.
With Meta now all but forcing advertisers into Advantage+, or switching it on behind the scenes if you do not read the fine print, it is time to use actual data, not opinion, to work out how advertisers should really use Advantage+, and when to stick to their manual guns instead.
So I had the fearless Wicked DB team pull the data on 55,661 Meta campaigns, comparing January through May 2024 against 2025, to finally get to the bottom of a few things. Let's dive in.
Topics: Wicked Reports marketing attribution ROI Meta Advertising nCAC Meta Advantage Plus Campaing Advantage+ vs Manual Meta Campaigns
4 min read
iOS 26 and Tracking : What Marketers Need to Know
-2.png)
iOS 26 and Tracking Parameters: What Performance Marketers Need to Know
Every new iOS release sets off the same alarm across the performance marketing community, and iOS 26 is no exception. For marketers, agencies, and analysts, the fear is always the same: will my tracking break, and will I lose visibility into what is actually driving results? Here is what iOS 26 changes, who it affects, and why it matters more for the ad platforms than it might for you.
THE GOOD NEWS FIRST
If you use Wicked Reports, iOS 26 does not break your attribution. Our tracking methodology is built on first-party, server-side data rather than the fragile URL identifiers Apple keeps targeting, so it remains intact. The ad platforms are a different story, and understanding why is the key to adapting well.
Topics: Wicked Reports Apple Privacy First-Party Data iOS 26 Tracking Parameters Marketing Attribution
5 min read
Meta Advantage+ vs Manual : 55,661 Campaigns Analyzed
-Aug-17-2026-08-50-00-2630-AM.png)
Meta Advantage+ vs Manual: What 55,661 Campaigns Reveal About nCAC
The promise of Meta's Andromeda AI brain sorting through a billion users to find your customers on auto-pilot sounds enticing. But is it actually good for brands? I have spent 10 years tracking Meta campaign performance against actual orders, and four things have stayed true the entire time:
Meta overstates its ability to drive immediate bottom-of-funnel sales.
Meta understates its ability to drive top-of-funnel cold traffic that leads to new customers.
Meta shows a lot more ROAS when you widen the attribution window.
Meta's Conversion API is heavily optimized for immediate sales on the default setup.
With Meta now pushing advertisers hard toward Advantage+, and switching it on behind the scenes if you do not read the fine print, it is time to settle this with actual data instead of opinion. So I had the Wicked DB team pull 55,661 Meta campaigns and compare January through May 2024 against the same window in 2025. Here is what the data shows.
Topics: Wicked Reports marketing attribution ROI Meta Advertising nCAC Digital Marketing Insights
8 min read
How to Calculate Your True New Customer Acquisition Cost (nCAC)
-Aug-13-2026-07-47-26-4358-AM.png)
Calculate Your True New Customer Acquisition Cost (nCAC)
If you run paid acquisition for a brand or an agency, you already know the goal: bring in new customers profitably. The problem is that the number most people use to measure that, the cost per acquisition their ad platform reports, is quietly lying to them. It blends new customers and repeat buyers into one figure, which makes acquisition look cheaper and easier than it actually is. The metric that tells you the truth is your new customer acquisition cost, or nCAC. Here is what it is, how to calculate it, and how to use it to grow.
Topics: Wicked Reports New Customer Acquisition Cost (nCAC) Data New Customer Acquisition Cost (NCAC) lower nCAC
5 min read
Is New Customer Growth Killing Your Profit? LTV : nCAC
-Aug-17-2026-07-58-14-4536-AM.png)
Is New Customer Growth Killing Your Profit?
New customers feel like winning. The dashboard climbs, orders roll in, and it looks like growth. But here is the uncomfortable question most brands never ask: is all that new-customer growth actually making you money, or is it quietly costing you more than it brings in? Growth and profit are not the same thing, and confusing them is how brands scale their way into trouble. This is about the number that tells you which one you actually have.
Topics: Wicked Reports Attribution Health LTV:NCAC Ratio New Customer Acquisition Cost (NCAC) Google Analytics 4 vs. Attribution Tools
7 min read
Stop Wasting Your Marketing Budget: Master Attribution
-Aug-19-2026-10-08-51-6618-AM.png)
Stop Wasting Your Marketing Budget: How to Master Marketing Attribution
You have probably heard the old line: "Half my marketing is wasted, I just don't know which half." It was born in the age of newspaper and catalog ads, and you would think all our digital tools would have killed it off by now. Yes and no. The data is far richer, but most marketers still cannot say with confidence which of their efforts actually drive sales. Getting attribution right is still hard. The good news is that it comes down to four connected areas, and if you master all four, you stop guessing at which half is wasted and start knowing. Stumble on even one and the whole picture falls apart. The four are tracking, attribution, analysis, and action.
Topics: Wicked Reports attribution windows Attribution Health multi-touch attribution Marketing Attribution marketing ROI measurement
5 min read
Meta Conversion Attribution : Time of Click vs Time of Sale
-4.png)
How to Optimize ROI With Meta Conversion Attribution
Ever felt confused when your Meta ad spend does not line up with the sales you are actually seeing? You are not alone. It is one of the most common sources of frustration in paid social, and a lot of it comes down to one thing most marketers never think about: when Meta counts a conversion. Understanding that, and specifically the difference between time of click and time of sale, is the key to reading your Meta performance accurately. Here is how it works and how to use it.
Topics: Wicked Reports Attribution Health multi-touch attribution time of click vs time of sale digital marketing attribution models
5 min read
Wicked Reports vs Elevar vs Blotout : How They Compare
-Aug-13-2026-07-29-54-5880-AM.png)
Wicked Reports vs Elevar vs Blotout: A High-Level Comparison
People weighing up attribution and tracking tools often ask whether they should use Wicked Reports, Blotout, or Elevar. It is a fair question, and the honest answer is that the three are not really the same kind of tool. Blotout and Elevar sit closer to each other as tracking-infrastructure options, while Wicked Reports does something different and can work alongside either one. Here is a high-level, practical comparison of what each does best.
A note before the details : tracking tools evolve quickly, and the descriptions below reflect how each competitor publicly positioned itself as of writing. For anything decision-critical, check each vendor's current documentation, since their features change. Our aim here is to explain the categories these tools fall into, not to freeze a moving target.
Topics: Wicked Reports Attribution Health multi-touch attribution First-Party Data Marketing Attribution
7 min read
Boost Your Sales with E-commerce Marketing Analytics
-Aug-11-2026-08-14-40-4464-AM.png)
BOOST YOUR SALES WITH ECOMMERCE MARKETING ANALYTICS: MEASURE THE RIGHT METRIC FOR EACH CAMPAIGN
Running an ecommerce business means juggling products, site, and campaigns, and eventually every decision comes down to the data. But most ecommerce marketing analytics lead you astray in two specific ways: they judge every campaign by the same metric, and they trust each platform's self-reported numbers. Fix both, and your analytics start telling you the truth. Here is how to choose the right metric for each campaign and measure it against real revenue.
Topics: Wicked Reports attribution windows Attribution Health multi-touch attribution Marketing Automation Data-Driven Decisions
6 min read
Boost ROI with Google Analytics Attribution & Key Event Insights
-Aug-11-2026-07-54-24-6731-AM.png)
GA4 ATTRIBUTION AND KEY EVENTS IN 2026 : HOW TO USE THEM TO DECIDE WHERE TO SPEND
Every ad campaign eventually forces the same decision. Do you pour more budget into it, or kill it? Get that call right consistently and you scale profitably. Get it wrong and you either starve a winner or keep feeding a loser. Google Analytics 4 gives you attribution reports and Key Events that can help you make that call, if you know how to read them and where they stop being trustworthy. Here is how to use GA4 attribution and Key Events to guide spend decisions, and where you still need to look beyond GA4 to avoid an expensive mistake.
Topics: Wicked Reports attribution windows Attribution Health multi-touch attribution Marketing Attribution Meta Ads Manager
4 min read
Solving Meta Algorithm Problems : A Diagnostic Guide

Solving Meta Algorithm Problems: Symptoms, Causes, and Fixes
If you run Meta ads, you know the frustration: the campaign looks fine on one metric and falls apart on another, and it is never quite clear why. Most of the time these are not random glitches. They are predictable symptoms of how Meta's algorithm optimizes, and once you can recognize them, you can diagnose and fix them. Here is a practical guide to the most common Meta algorithm problems, why they happen, and what to do about each.
Topics: Wicked Reports Attribution Health multi-touch attribution Ad Performance Issues Meta Ads Algorithm Paid Social Media
6 min read
Boost Sales with Smart Facebook Prospecting Campaigns
-Aug-10-2026-09-17-10-7628-AM.png)
BOOST SALES WITH SMART FACEBOOK PROSPECTING CAMPAIGNS
Facebook prospecting campaigns offer a massive potential audience. But are your campaigns truly reaching new customers, or are you just retargeting the same warm leads under a prospecting label? This is how to tell the difference, see what Facebook's reporting hides, and get your prospecting ads actually finding cold traffic.
For years marketers have hit the same wall. They launch Facebook prospecting campaigns, see decent in-app ROAS, and assume all is well, while their real new customer acquisition cost, or nCAC, quietly climbs through the roof.
Topics: attribution windows Attribution Health multi-touch attribution Facebook Ads Strategy Lead Generation
5 min read
Average Order Value Is Lying to You : Why You Need to Measure New-Customer AOV
-Aug-10-2026-09-35-56-5286-AM.png)
AVERAGE ORDER VALUE IS LYING TO YOU : WHY YOU NEED TO MEASURE NEW-CUSTOMER AOV
Average order value is one of the most-chased metrics in ecommerce, and one of the most misleading when you look at it blended. A rising AOV feels like progress. But a single blended AOV number hides the one distinction that actually matters for growth: are your high-value orders coming from new customers, or from existing customers who were always going to buy? Until you separate those two, you are optimizing in the dark. Here is why new-customer AOV is the number to watch, and how to raise it.
Topics: Wicked Reports attribution windows Attribution Health multi-touch attribution customer lifetime value (CLV)
5 min read
Email Marketing Benchmarks : Why Open Rate Lies
-1.png)
EMAIL MARKETING BENCHMARKS ARE LYING TO YOU : WHAT ACTUALLY MATTERS IN 2026
Every year, a dozen platforms publish the same email benchmark report - here's the average open rate, here's the average click rate, here's how you stack up. Marketers screenshot the numbers, compare their open rate to the industry average and feel good or bad accordingly.
Here's the uncomfortable truth for 2026. Your open rate is one of the least trustworthy numbers in your entire marketing stack and building strategy around it is a great way to optimize something that doesn't move revenue. Let me explain why — and what to measure instead.
Topics: Email Marketing Wicked Reports revenue per recipient email attribution email benchmarks
5 min read
Why GA4 Fails at Conversion Tracking & How to Fix It
-1.png)
Why GA4 Fails at Conversion Tracking (and What to Do Instead)
The marketing world is obsessed with data — but are we measuring what matters? Google Analytics 4 promises enhanced tracking and deeper insight, yet several of its structural flaws can quietly sabotage your marketing with misleading conversion data, distorted audience metrics and a customer journey it can't fully see. This isn't about bashing Google. It's about knowing where GA4 misleads you, so you don't allocate budget on flawed numbers. Let's walk through the biggest flaws — and what to do instead.
Topics: Google Analytics Wicked Reports conversion tracking GA4 Alternatives GA4
5 min read
Meta Automatic Campaign Adjustments : Should You Worry?
-1.png)
META AUTOMATIC CAMPAIGN ADJUSTMENTS IN 2026 : SHOULD YOU BE WORRIED?
Meta now adjusts your campaigns for you, automatically, whether you asked it to or not. As of late 2025 Advantage+ is the default for new campaigns, and in early 2026 Meta merged manual and Advantage+ into a single interface where AI optimization of audience, placements, budget, and creative is simply on unless you dig in to turn pieces off. For a lot of advertisers this feels alarming, the platform is making changes to your ads, your targeting, and your spend without asking. So should you be worried? The honest answer is nuanced, do not panic about the automation itself, but be very worried about who is keeping score of whether it works.
Topics: Wicked Reports Marketing Attribution Meta Advantage+ meta ads automation campaign optimization
5 min read
Attribution Modeling Types Explained : 2026 Guide
-3.png)
ATTRIBUTION MODELING TYPES EXPLAINED : A 2026 GUIDE TO CHOOSING THE RIGHT ONE
Every marketer wants the answer to one question - what's actually working? It's easy to spread budget across channels and hope. The hard part — the part that separates brands that scale from brands that guess — is knowing how each touch actually contributes to winning a customer. That's what attribution modeling is for.
Attribution models move you past surface metrics to show which marketing activities influence which parts of the customer journey. Used well, they replace guesswork with data you can allocate budget on. Used badly — or trusted blindly from a single ad platform — they can point you confidently in exactly the wrong direction. This guide covers the main model types, when each fits, and the catch that undermines all of them if you're not careful.
Topics: Wicked Reports Attribution Health multi-touch attribution ad spend optimization marketing ROI
6 min read
How to Use MER as a North Star Metric to Scale Revenue
-4.png)
How to Use MER as a North Star Metric for Profitable Ad Scaling
Update Note: In an era where iOS privacy changes and increasingly unreliable platform tracking have caused massive signal loss for marketers, relying solely on platform-specific ROAS is dangerous. This is why MER (Marketing Efficiency Ratio) has become one of the most reliable North Star metrics for 2026 and beyond.
Not enough marketing teams spend the time to get aligned with the boss on a north star metric and it wreaks havoc and causes stress...and nobody wants that!
Topics: Wicked Reports Marketing Efficiency Ratio North Star Metric ad budget scaling
5 min read
Is ROAS Dead? Why the Rumors Are Greatly Exaggerated

The Rumors of ROAS' Demise Have Been Greatly Exaggerated
It's clickbait that works - marketers screaming from the mountaintops "ROAS is DEAD!".
Topics: Wicked Reports roas multi-touch attribution Ad Platform ROAS marketing measurement
6 min read
Meta Removed Detailed Targeting Exclusions : The 2026 Fix
-1.png)
META KILLED DETAILED TARGETING EXCLUSIONS — HERE'S HOW TO KEEP YOUR TOP-OF-FUNNEL ACTUALLY COLD IN 2026
If you run top-of-funnel prospecting on Meta, one quiet change has been steadily breaking the thing that makes TOF work: your ability to keep warm audiences out of it. Detailed targeting exclusions are gone, and as of early 2026 Meta has finished enforcing it. Here's exactly what changed, why it's a problem for prospecting, and the setup that fixes it.
Topics: Facebook Wicked Reports Facebook conversions Facebook ads Facebook pixels Ad Operations TOF Prospecting
5 min read
FunnelVision : See Which Funnel Stages Waste Ad Spend
.png)
FUNNELVISION : SEE WHICH FUNNEL STAGES ACTUALLY DRIVE SALES AND CUT WASTED AD SPEND
Most ecommerce brands can tell you their overall ROAS. Far fewer can tell you which stage of their funnel is quietly burning money. That gap is where ad budget goes to die. FunnelVision is the Wicked Reports report built to close it by showing you the full customer journey stage by stage so you can see exactly where spend is working and where it is wasted. Here is what it does and why it matters.
Topics: Wicked Reports funnelVision ad spend optimization marketing ROI full funnel attribution
5 min read
BFCM Attribution Strategy : What the Data Actually Shows
-2.png)
How to Win Black Friday and Cyber Monday With Attribution Data
Most brands walk into Black Friday and Cyber Monday and repeat last year's plan on instinct. The ones who win do something different: they reverse-engineer what actually drove sales the previous BFCM, then build this year's plan on that evidence instead of guesswork. If you have measurement and attribution data from last Q4, it is the most valuable asset you have going into this one. Here is what the data consistently shows about how BFCM sales really happen, and how to act on it.
Topics: Wicked Reports Marketing Attribution bcfm strategy black friday cyber monday
5 min read
Apple Link Tracking Protection & Attribution guide
.png)
APPLE'S LINK TRACKING PROTECTION IN 2026: WHAT IT ACTUALLY DID TO ATTRIBUTION (AND WHAT TO DO NOW)
Short version - Apple has spent the last few years quietly stripping the tracking parameters that marketers rely on to know which ads work. It started with iOS 17 in 2023 and iOS 26 escalated it. If your tracking depends on click IDs, a growing share of your Safari and Apple traffic is now going dark but UTMs survive and there are concrete ways to keep your attribution accurate. Here's the real state of play and what to do about it.
Topics: Email Marketing Automatic Link Builder Facebook conversions UTM value UTM UTM values Attribution Health WBRAIDS GCLID
7 min read
How to Choose Attribution Software : 2026 Buyer's Guide
.png)
HOW TO CHOOSE MARKETING ATTRIBUTION SOFTWARE IN 2026: THE BUYER'S GUIDE
If you're evaluating attribution tools, you've probably noticed they all claim the same thing - accurate, multi-touch, full-funnel measurement. They can't all be right and the differences that matter aren't the ones on the feature-comparison grids. This is a practitioner's guide to the questions that actually separate a tool that will change how you spend from one that just gives you a prettier version of the numbers you already can't trust.
Topics: Wicked Reports attribution models Ecommerce multi-touch attribution last click attribution
5 min read
Find Hidden ROAS : Custom Attribution in Wicked Reports

How to Find Hidden ROAS With Custom Attribution
Here is a frustration every serious advertiser knows. Meta says your campaign drove 40 sales. Google claims a big chunk of the same sales. Your real revenue does not match either one. So which platform is lying? The honest answer is all of them, a little, because each one counts every sale it touched as its own, blind to everything that happened on the other channels. Wicked Reports exists to cut through that and show you the true, reconciled picture. But there is a diagnostic inside Wicked that helps you understand exactly where the gap comes from, and it is worth knowing about. We call it finding your hidden ROAS.
Topics: Wicked Reports Marketing Attribution marketing ROI Cross-Channel Attribution last click attribution Hidden ROAS
4 min read
Fastest-Growing E-commerce Sectors for 2026 and Beyond
.png)
FASTEST-GROWING E-COMMERCE SECTORS FOR 2026 AND BEYOND
Online shopping stopped being a pandemic story a while ago — it's simply how a growing share of the world buys. In 2026, global ecommerce is expected to reach roughly $6.88 trillion - accounting for more than a fifth of all retail sales worldwide and it's on track to pass $8 trillion by 2027. Growth has cooled from its 2020–2021 spike into a steadier high-single-digit climb — but it's still expanding at more than twice the rate of physical retail.
What's changed most since the early-pandemic surge isn't whether people shop online — it's what they buy online and how. The categories growing fastest now are being driven less by lockdown habit and more by structural shifts - grocery finally going digital at scale, mobile-first buying (mcommerce is now around 59% of ecommerce sales), AI-powered personalization, social commerce, and the maturing of direct-to-consumer brands.
Topics: Wicked Reports Ecommerce Trends customer lifetime value (CLV) DTC growth trends (Direct-to-Consumer) online retail
4 min read
Find Missed Ad Opportunities : Campaigns With Delayed Revenue
-Aug-17-2026-07-37-49-7747-AM.png)
How to Find Missed Ad Opportunities Hiding in Delayed Revenue
Every media buyer has done it. You launch a campaign, watch it for a few days, and it is not hitting the numbers you wanted. So you cut it and move on to the next one. Fast decision, imperfect information, next. But here is the question almost nobody goes back and asks: what happened to the customers that campaign already touched? Because some of the campaigns you killed were not failures. They were slow. And the revenue showed up after you had already pulled the plug. That is a missed opportunity, and most brands never even know it happened.
Topics: Wicked Reports Marketing Attribution Ad Campaign Optimization Inactive Campaigns Revenue Media Buyer Strategy
6 min read
Multi-Touch Attribution for Ecommerce : A Practical Guide
-Aug-13-2026-09-07-18-0936-AM.png)
How to Use Multi-Touch Attribution for Your Ecommerce Store
If you run an ecommerce store, you already know your customers do not buy in a straight line. Someone sees a Facebook ad, forgets about it, gets an email two weeks later, clicks a Google search result a month after that, and finally buys. So which of those touches gets the credit for the sale? If you are using last-click, the answer is "only the last one," and that is exactly how ecommerce brands end up defunding the campaigns that actually drive their growth. Multi-touch attribution fixes that. Here is how it works and how to apply it to your store.
Topics: Wicked Reports Ecommerce marketing attribution ROI Linear Attribution Attribution Health multi-touch attribution
7 min read
How to Scale Facebook Ads for Ecommerce in 2026 : 7 Tips
.png)
HOW TO SCALE FACEBOOK ADS FOR ECOMMERCE IN 2026: 7 TIPS (AND THE ONE THING TO FIX FIRST)
Scaling Facebook ads is where most ecommerce brands either break through or blow up their budget. Push too hard and you reset the learning phase and spike your costs. Push too timidly and you leave growth on the table. And in 2026, with median CPMs up sharply and Meta's automation running more of the account than ever, the margin for error is thinner. Here are seven tips that actually work now — but first, the one thing you have to fix before you scale a single dollar.
Topics: Wicked Reports Facebook ads Meta Ads eCommerce Advertising Ad Scaling Strategy
6 min read
How to Use Ecommerce LTV to Optimize Cold Traffic
.png)
HOW TO USE ECOMMERCE LTV TO OPTIMIZE COLD TRAFFIC AD SPEND
Customer lifetime value is the most underused metric in ecommerce — and that's exactly why it's an edge. Most brands optimize their cold-traffic ads for the cheapest possible click, lead or first purchase. The brands that win optimize for something their competitors aren't even measuring - which cold traffic turns into high-value, repeat customers. This is how you do that.
Topics: Wicked Reports cohort analysis customer lifetime value (CLV) Cold Traffic Attribution ecommerce metrics
5 min read
What Is a Good Ecommerce CAC? Benchmarks & Truth
-1.png)
WHAT IS A GOOD ECOMMERCE CAC? (AND WHY YOUR PLATFORM'S CAC IS FICTION)
Every ecommerce operator wants a number - "what's a good customer acquisition cost?" Here's the honest answer up front — in 2026, the broad ecommerce average runs about $68–$84 to acquire a customer but that average is nearly useless on its own because CAC ranges from around $23 for pet brands to $377+ for electronics. And it's climbed 40–60% since 2023, so whatever you paid two years ago, you're paying materially more now.
But the benchmark isn't the real problem. The real problem is that the CAC number most brands are looking at is wrong before they even compare it to anything — because it comes from an ad platform that can't actually measure it. Let's fix both.
Topics: Wicked Reports customer lifetime value cac ecommerce metrics LTV to CAC
5 min read
Digital Marketing Metrics That Actually Matter and How To Use Them
.png)
Digital Marketing Metrics That Actually Matter in 2026 (and How to Use Them)
Most brands drown in metrics and starve for insight. The dashboards are full, but the number that would actually change a decision is either missing or wrong. This is a working guide to the handful of marketing KPIs that move the needle for an ecommerce brand - CPL, CAC, ROAS, ROI,and the one most of your competitors ignore, LTV - plus the reason every one of them is only as good as the data underneath it.
Topics: Wicked Reports marketing metrics LTV roas customer lifetime value (LTV) Ecommerce Attribution
5 min read
What is a Good ROAS for Ecommerce? Benchmarks & ROI Tracking
-2.png)
WHAT IS A GOOD ROAS FOR ECOMMERCE IN 2026? THE HONEST ANSWER (AND WHY THE NUMBER LIES)
Everyone wants a single number - what's a good ROAS? Here's the honest answer up front — the commonly quoted benchmark is 3:1 to 4:1, but the actual 2026 ecommerce average has slid to around 2.87:1, and the median is closer to 2:1. That means roughly half of all ecommerce brands are running below a 2:1 return. So if you're benchmarking against "4:1," you're comparing yourself to a number most stores never hit.
But the bigger problem isn't the benchmark. It's that ROAS itself — the way most brands measure it — is being quietly mis-reported by the very platforms you're using to calculate it. Let's fix both.
Topics: ad metrics Wicked Reports Facebook ROI marketing metrics return on investment customer lifetime value roas eCommerce ROAS ROAS vs ROI
4 min read
What Is a Good Cost Per Lead (CPL)? The Honest Answer
.png)
COST PER LEAD (CPL): WHY IT MATTERS, AND WHY IT MATTERS LESS THAN YOU THINK
If you run paid ads, you track CPL. Every media buyer does. It's the metric that feels like it tells you whether your advertising is working. Here's the contrarian truth. CPL is one of the easiest metrics to measure and one of the easiest to be misled by. Let's cover what it is, how to calculate it and then why chasing a lower CPL is quietly costing some brands their profitability.
Topics: cost per lead Wicked Reports marketing metrics customer lifetime value (CLV) Lead Generation
6 min read
Predict Your Customers' Buying Cycle : When They'll Buy
.png)
HOW TO PREDICT YOUR CUSTOMERS' BUYING CYCLE: THE TIMING DATA THAT TELLS YOU WHEN TO SPEND
Most marketers obsess over which ad drove a sale. Far fewer ask a question that's just as valuable - how long does it take? The gap between a customer's first click and their purchase — their buying cycle — is one of the most useful and most ignored numbers in ecommerce. Get a handle on it and you stop killing campaigns too early, stop misjudging ROI and start timing your spend to how your customers actually buy. Here's how buying-cycle prediction works and what to do with it.
Topics: Wicked Reports Marketing Attribution Sales Velocity time to purchase buying cycle
13 min read
How US Ad Spending Compares to the Rest of the World (2026)
.png)
How Ad Spending in the US Compares to the Rest of the World
Advertising is one of the largest and most pervasive industries on earth — and one of the most varied. TV spots, internet ads, radio, billboards and signage, social campaigns - each category splits into dozens of sub-formats and how they're used and consumed shifts from one country to the next.
Topics: ad spend Wicked Reports Wicked Reports online marketing marketing budget breakdown Global Advertising
7 min read
How to Optimize Ad Campaigns : 3 Things That Move ROI
-2.png)
HOW TO OPTIMIZE YOUR AD CAMPAIGNS : THE 3 THINGS THAT ACTUALLY MOVE ROI
There is no shortage of advice on optimizing ad campaigns, and most of it is noise about bidding tweaks and creative hacks. After tracking billions of dollars in ad spend, we have found that campaign optimization really comes down to three things, and none of them are tricks. They are about measuring the right way so you make the right calls. Here they are.
Topics: Wicked Reports customer lifetime value (CLV) Cross-Channel Attribution Ad Optimization buying cycle
6 min read
Why Did My Ad Get Clicks But No Attributed Sales?
-Aug-04-2026-07-38-04-4980-AM.png)
WHY DID MY AD NOT GET CREDIT FOR THE SALE? UNDERSTANDING CLICKS THAT DON'T CONVERT ON PAPER
Here is a scenario that drives marketers up the wall. You can see people clicking your Facebook ad. You know those clicks are happening. And yet your attribution tool shows that ad getting little or no credit for sales. So what gives? Is the tracking broken, or is something else going on? Usually it is something else, and understanding it is the difference between confidently killing a dud and accidentally killing a winner. Here is why a clicked ad might not get sale credit, and how to check what really happened.
Topics: Wicked Reports multi-touch attribution Ad Attribution facebook ad roi click attribution
6 min read
How to Track SMS Conversions for Real ROI
.png)
HOW TO TRACK AND OPTIMIZE SMS CONVERSIONS FOR REAL ROI
SMS has quietly become one of the highest-engagement channels in ecommerce. Open rates dwarf email and a well-timed text can drive a sale in minutes. But that immediacy hides a measurement problem. Most brands can see how many people clicked an SMS link and almost none can tell you what that channel is truly worth once you account for the full customer journey. If you are scaling SMS on click counts or your SMS platform's own numbers you are probably misreading its real contribution. Here is how to track and optimize SMS conversions properly.
Topics: Wicked Reports Marketing Attribution SMS Tracking SMS Conversion Optimization SMS Marketing
5 min read
Google Ads Data-Driven Attribution Explained (2026)
-1.png)
DATA-DRIVEN ATTRIBUTION IN GOOGLE ADS : WHAT IT IS AND WHAT IT STILL CAN'T SEE (2026)
If you run Google Ads, the attribution question has been quietly decided for you. As of 2026, Google Ads offers exactly two attribution models - Data-Driven Attribution (the default) and Last Click. Everything else is gone. Here's what that means, why data-driven attribution is genuinely better than the last-click model it replaced and the hard limit that no Google model, however smart, can get past.
Topics: Wicked Reports Google Ads multi-touch attribution Data Driven Strategy marketing ROI
4 min read
The Biggest E-commerce Sectors by Revenue (2026)

THE BIGGEST E-COMMERCE SECTORS BY REVENUE IN 2026
Global ecommerce is now a roughly $6.9 trillion market — more than a fifth of all retail sales worldwide — and it's still growing at more than twice the rate of physical stores. But that spend isn't distributed evenly. A handful of categories account for an outsized share of every dollar spent online, and knowing which sectors are biggest by revenue tells you where the money actually is today.
This is a ranking by size — total online revenue — not by growth rate. (If you want to know which sectors are growing fastest rather than which are largest right now, that's a different question, and we cover it in our companion piece on the fastest-growing e-commerce sectors.) Here, we're answering "where is the most consumer spend concentrated online today?"
Topics: Wicked Reports Marketing Attribution Data top e-commerce categories online retail e-commerce trends
7 min read
How to Choose Attribution Software : Buyer's Guide
-4.png)
HOW TO CHOOSE MARKETING ATTRIBUTION SOFTWARE : THE BUYER'S GUIDE
Every attribution tool on the market claims the same thing. Accurate, multi-touch, full-funnel measurement. They cannot all be right, and the differences that actually matter are not the ones on the feature-comparison grids. This is a practitioner's guide to the questions that separate a tool that will change how you spend from one that just gives you a prettier version of the numbers you already cannot trust.
Topics: Wicked Reports First-Party Data Marketing Attribution Attribution Software martech
5 min read
2026 Guide : iOS Privacy & First-Party Tracking
Apple's Privacy Changes and Marketing Attribution : Is Wicked Reports Affected?
You have heard about the industry-wide shift caused by Apple's App Tracking Transparency framework and the steady evolution of its privacy stack. Every year another Apple update lands, and every year advertisers ask the same question: does this break my tracking?
If you use Wicked Reports, the short answer is no. Here is the long answer, and why the reason matters more than any single iOS version.
Topics: Wicked Reports Email ROI Facebook ads ios iOS privacy updates 2026 ATT compliance
5 min read
GCLID vs GBRAID vs WBRAID: Google Ad Identifiers (2026)
-2.png)
GCLID vs GBRAID vs WBRAID: Decoding Google's Ad Identifiers in 2026
If you run Google Ads, you've probably noticed something odd in your landing-page URLs. Some clicks arrive with the familiar gclid parameter. Others show up with gbraid or wbraid instead. And if your tracking only captures gclid, you're silently losing attribution data on a growing share of your traffic because Google now uses three different click identifiers depending on the device, browser, and the user's privacy settings.
Here's what each one is, when Google sends it, and why capturing all three now matters more than ever.
THE SHORT VERSION
- GCLID is the original Google Click Identifier, used since 2005. It's the gold standard — a rich, deterministic identifier tied to a single click, carrying campaign, ad group, keyword, device, and more. But it only works where Apple allows it.
- GBRAID and WBRAID are the privacy-safe parameters Google introduced in 2021 for iOS traffic where gclid can no longer be used. They measure performance in aggregate, without identifying an individual user.
Topics: conversion tracking WBRAIDS GBRAIDS Google Ads GCLID Apple ATT
5 min read
How to Attribute Conversions With No Trackable Click
-4.png)
HOW TO ATTRIBUTE CONVERSIONS THAT HAVE NO TRACKABLE CLICK
Most attribution works by following clicks. Someone clicks an ad, a link, an email, and the tool ties that click to the eventual sale. But some of your most valuable conversions never involved a trackable click at all. A lead you met at a trade show. A list you imported into your CRM. A customer who booked a call after weeks of nurture. An order that came in with no UTM on the link, or no click to record. These are real conversions with real revenue, and by default they sit in your reporting as unattributed, orphaned from the marketing that actually created them. Here is how to bring them into your attribution so nothing valuable goes uncredited.
Topics: Wicked Reports Marketing Attribution clicks API unattributed conversions offline conversion attribution
4 min read
Automated ROI & LTV Email Reporting
-1.png)
AUTOMATED ROI AND LTV EMAIL REPORTING : WHY A REGULAR REVIEW BEATS A DASHBOARD YOU NEVER OPEN
Most marketing data dies in a dashboard nobody opens. You have the reports, they are accurate, and they sit there unread while decisions get made on gut feel and platform numbers. The problem is rarely the data, it is the habit. The marketers who actually grow are the ones who look at their true ROI and lifetime value on a regular cadence and act on it. Automated email reporting exists to build that habit for you, by putting the numbers that matter in your inbox on a schedule so the review happens whether or not you remember to log in.
Topics: Wicked Reports Marketing Attribution customer lifetime value (LTV) roi reporting marketing reporting
8 min read
Marketing Attribution : The Complete Guide
-1.png)
MARKETING ATTRIBUTION : THE COMPLETE GUIDE TO TRACKING ROI AND LTV ACROSS PLATFORMS
Marketing attribution is the discipline of identifying which channels, campaigns and individual ads actually contributed to a sale. It sounds simple until you remember how people really buy. Most customers use several channels across days or weeks before a single purchase, so you cannot just credit whatever they touched last. This is the complete guide to how attribution works, the models you can use, why platform reporting falls short and how to measure ROI and lifetime value across every channel in 2026.
Topics: Wicked Reports attribution models customer lifetime value multi-touch attribution Marketing Attribution
6 min read
How to Track the ROI of Your Digital Marketing : 2026 Guide
.png)
How to Track the ROI of Your Digital Marketing: The 2026 Guide to Measuring Real Profit and LTV
In a multi-channel world, a large share of digital ad spend is quietly wasted — misattributed to the wrong campaigns, spent showing the wrong ads to the wrong people. Credible 2026 estimates put programmatic waste around a quarter of spend and studies suggest proper attribution alone recovers roughly 27% of otherwise-wasted budget. However you measure it, the pattern is the same - money leaks when you can't see which campaigns actually drive revenue.
Tracking real ROI is how you stop the leak - spend where it works, cut what doesn't. But doing it accurately is harder than the formulas make it look. This guide covers how to set up ROI tracking for digital campaigns, the common traps, and how to avoid them.
Frustrated by ROI numbers you don't trust? Talk to a Wicked Reports optimization expert.
Topics: Wicked Reports ROI customer lifetime value multi-touch attribution marketing attribution solutions
4 min read
Why First-Party Data Is Essential for Attribution
.png)
WHY FIRST-PARTY DATA IS THE FOUNDATION OF ACCURATE MARKETING ATTRIBUTION
There's a lot of noise about data in marketing, but one principle has only gotten more true - the data you own is worth more than the data you rent. First-party data — the information you collect directly, own outright and control — is the single most reliable foundation for knowing what your marketing actually did. Here's what it is, why it beats the alternatives and why accurate attribution is impossible without it.
Topics: Wicked Reports conversion tracking First-Party Data Marketing Attribution data privacy marketing
5 min read
Leads Take Time to Buy : Why Your Measurement Window Matters
-Aug-17-2026-08-38-12-9081-AM.png)
Leads Take Time to Buy: Measure Over the Full Journey, Not the First Week
Two marketers run the same kind of campaign. One checks response every week, sees soft early numbers, and cancels what turns out to be his most profitable campaign. The other sticks with an offer whose leads take longer to convert, and it becomes a top performer. The only difference between them is that one understood how long his leads actually take to buy, and the other did not. That single piece of knowledge, your real time-to-convert, quietly determines whether you scale your winners or kill them by accident.
Topics: Wicked Reports customer journey multi-touch attribution last click attribution leads take time to buy time to purchase
4 min read
Cohort Analysis : Track Long-Term Revenue, LTV & Break-Even
.png)
COHORT ANALYSIS: HOW TO TRACK LONG-TERM REVENUE, LTV, AND DAYS TO BREAK EVEN
Here's a question most ecommerce brands can't answer accurately: how much money will the customers you acquire this month spend with you over the next year — and which of your campaigns brought in the ones worth the most? If you can't answer that, you're allocating budget blind. Cohort analysis is how you answer it.
Topics: Wicked Reports cohort analysis customer lifetime value marketing ROI break-even point
6 min read
E-learning Marketing ROI : Track Course Sales
.png)
E-LEARNING MARKETING ROI IN 2026: HOW TO TRACK COURSE SALES AND LEADS THAT ACTUALLY CONVERT
Selling online courses and digital education is one of the hardest things to measure well. Buyers research for weeks. They sign up for a free webinar, download a lead magnet, sit on your email list, watch three more videos and finally buy the course a month later. By the time they purchase, the ad that first brought them in is long forgotten by every ad platform tracking it. If you are running paid traffic to sell courses and judging it on last-click ROAS you are almost certainly misreading what works. Here is how to track e-learning marketing ROI properly.
Topics: Wicked Reports Marketing Attribution marketing ROI e-learning online courses
5 min read
Shopify Attribution : Track Real Revenue by Source
-2.png)
SHOPIFY ATTRIBUTION : HOW TO CONNECT YOUR SHOPIFY REVENUE TO THE MARKETING THAT DROVE IT
Shopify tells you what sold. What it cannot tell you, on its own, is which ad, email, or campaign actually created each customer, or which of your marketing is bringing in buyers worth keeping. Shopify sees the order. It does not see the weeks-long, multi-channel journey that led to it. If you are running paid traffic into a Shopify store and judging performance on what the ad platforms report, you are almost certainly misreading which marketing works. Here is how to connect your real Shopify revenue to the marketing that drove it.
Topics: Wicked Reports Shopify marketing ROI Ecommerce Attribution Shopify Attribution
6 min read
Podcast Attribution : How to Track Podcast Ad Sales
-Jul-31-2026-08-39-51-8134-AM.png)
PODCAST ATTRIBUTION : HOW TO TRACK THE SALES YOUR PODCAST ADS ACTUALLY DRIVE
Podcast advertising works. US podcast ad revenue is now above four billion dollars, and studies put podcast long-term ROAS around 4.9x, well ahead of the roughly 3.7x average across media. The problem is not whether podcast ads drive sales. It is proving which ones do. Podcast is the hardest major channel to attribute, because a listener cannot click an ad mid-episode. They hear you on a morning commute, think about it for two days, then buy after a search later in the week, on a different device, through a path that looks nothing like the podcast that started it. Here is how to actually track the sales your podcast ads drive.
Topics: Wicked Reports podcast attribution multi-touch attribution podcast promo code tracking podcast advertising
5 min read
How to Retarget Email Leads with Google Ads
-4.png)
HOW TO RETARGET YOUR EMAIL LEADS WITH GOOGLE ADS (AND PROVE WHICH RETARGETING ACTUALLY PAYS)
Your email list is one of the most valuable audiences you own, and you can put it to work in Google Ads by retargeting those exact people as they browse YouTube, Gmail, Search and the web. It is called Customer Match, and it is far more powerful than it was a few years ago. But retargeting your list is only half the job. The other half, the half most advertisers skip, is proving which of that retargeting actually drove incremental sales rather than taking credit for purchases those customers were going to make anyway. Here is how to do both.
Topics: Wicked Reports multi-touch attribution google ads retargeting email remarketing customer match
5 min read
Mailchimp Attribution : Track Real Email ROI
.png)
MAILCHIMP ATTRIBUTION : HOW TO TRACK THE REAL EMAIL ROI MAILCHIMP CANNOT SHOW YOU
Mailchimp tells you who opened your email and who clicked. What it cannot tell you is the only thing that actually matters which is how much revenue each email campaign truly drove across the full customer journey. If you are judging your email program on opens and clicks you are measuring activity not money. Here is why Mailchimp reporting falls short on its own and how to track the real ROI of your email marketing.
Topics: MailChimp Wicked Reports Marketing Attribution email attribution email marketing roi
6 min read
Target YouTube Ads by Search History
-2.png)
HOW TO TARGET HIGH-INTENT YOUTUBE AUDIENCES BY SEARCH HISTORY IN 2026 (AND PROVE WHICH ONES ACTUALLY PAY OFF)
Most YouTube advertising is a spray of impressions at people who never asked to see you. There is a sharper way. Google lets you show your video ads specifically to people who have recently searched for the things you sell, which is about the highest-intent YouTube audience you can build. But targeting the right people is only half the job. The other half, the half most advertisers skip, is proving which of those audiences actually turned into profitable customers rather than just cheap views. Here is how to do both.
Topics: Wicked Reports Marketing Attribution Custom Segments YouTube Ads Video Ad Attribution search intent targeting
6 min read
How to Track YouTube Ads & Measure Real ROI
.png)
HOW TO TRACK YOUTUBE ADS AND MEASURE REAL ROI FROM VIDEO
The oldest problem in advertising still bites hardest on YouTube. As the saying goes, half your ad budget is wasted and you just do not know which half. Video makes that worse, because a YouTube ad so often does its work early — someone watches on their phone during a commute, forgets about it, then searches your brand three days later on a laptop and buys. Last-click attribution gives YouTube zero credit for that sale. If you are judging YouTube on what Google Ads reports, you are almost certainly underrating it. Here is how to track YouTube ads properly and measure their real ROI.
Topics: Wicked Reports conversion tracking marketing ROI YouTube Ads Video Ad Attribution
4 min read
GDPR, CCPA & Attribution : Measuring in a Privacy-First World
-Aug-13-2026-08-29-02-9907-AM.png)
Marketing Attribution in a Privacy-First World: GDPR, CCPA, and What Comes Next
Privacy regulation is no longer a one-time deadline you scramble to meet. Since GDPR arrived in 2018, it has been joined by CCPA, LGPD, and a steady stream of new global privacy laws, and more are coming. For marketers, the uncomfortable truth is that every one of these regulations chips away at the third-party tracking most attribution has quietly depended on. That sounds like a threat. For brands measuring the right way, it is actually an advantage. Here is why.
Topics: Wicked Reports GDPR GDPR compliance Wicked Reports data security marketing attribution compliance
5 min read
ActiveCampaign Attribution : Track Real Email ROI
-3.png)
ACTIVECAMPAIGN ATTRIBUTION : TRACK THE REAL REVENUE YOUR EMAIL DRIVES, NO UTMS REQUIRED
ActiveCampaign is a powerful email and marketing automation platform. What it cannot tell you on its own is which of your ads created the leads your automations nurture, or how much real revenue each campaign and sequence actually produced across the full customer journey. The Wicked Reports ActiveCampaign integration closes that gap, and it does it with one feature that sets it apart from every other email integration. It tracks every email click automatically, with no UTMs required. Here is how it works and why it matters.
Topics: Wicked Reports Active Campaign Marketing Attribution Marketing Automation email attribution
6 min read
The Missing Piece of Ecommerce Growth : Why Stores Guess
-2.png)
THE MISSING PIECE OF ECOMMERCE GROWTH : WHY MOST STORES ARE GUESSING
Growing an ecommerce store is like assembling a puzzle with four critical pieces. Miss any one and the picture never comes together. Most stores nail three of them and are quietly missing the fourth, which is exactly the one that tells them whether the other three are working. Here is the puzzle, and the piece almost everyone is missing.
Topics: Wicked Reports Marketing Attribution ecommerce growth marketing ROI people based attribution
5 min read
The 3 Truths of Ecommerce Marketing Growth
-Aug-20-2026-08-55-42-4556-AM.png)
The 3 Truths of Ecommerce Marketing
In a perfect world, growing an ecommerce store would be simple. Run ads until one shows a positive return, pour more budget into that ad, repeat. If it actually worked that way, we would all be ecommerce millionaires and there would be no need for attribution software at all. In reality, growth is harder and stranger than that, because it runs on a few counterintuitive truths that take most store owners years to learn. Grasp them and you can build a growth strategy based on how ecommerce actually works, not how we all wish it worked. There are three, and each one changes how you should market.
Topics: Wicked Reports Ecommerce Marketing Attribution marketing ROI measurement first-click attribution lead nurturing
6 min read
Klaviyo Attribution : Track Real Email & SMS ROI
KLAVIYO ATTRIBUTION IN 2026: HOW TO TRACK THE REAL ROI KLAVIYO CANNOT SHOW YOU
Klaviyo is the best-in-class email and SMS platform for ecommerce, and unlike most email tools it does report revenue, not just opens and clicks. That is a real strength. But there is a ceiling on what Klaviyo can tell you, and it is the same ceiling every single tool in your stack runs into. Klaviyo can only attribute the revenue it can see, which means it takes full credit for sales that other channels helped create and misses the assists your email and SMS provide to conversions that close elsewhere. Here is how to track the real ROI of your Klaviyo marketing.
Topics: Wicked Reports klaviyo Marketing Attribution email marketing roi
7 min read
Sales Velocity Report : Make Smarter Ad Decisions
-3.png)
HOW TO USE THE SALES VELOCITY REPORT TO MAKE SMARTER AD DECISIONS
One Wicked Reports customer almost canceled his most profitable Facebook campaign. He was measuring response every week, and on that timeline only 4.4% of new leads from those ads had purchased, so the campaign looked like a loser. But more than half his leads took over a week to buy, and over time those ads generated more than $800,000 in revenue on $125,000 of spend. Measuring weekly nearly cost him his best campaign. Measuring the real buying cycle saved it.
That is the entire point of the Sales Velocity Report. It answers a question most advertisers cannot answer, and the answer decides whether you scale profitably or bleed budget. How long does it actually take your leads to buy?
WHAT SALES VELOCITY ACTUALLY MEASURES
Sales velocity is the time it takes a lead to become a customer, measured from a real starting point such as first click or first opt-in through to the purchase. The Wicked Reports Sales Velocity Report shows you that timing across your customers, broken down by the milestones that matter.
First click to purchase.
How many days, on average, between a customer's very first interaction with you and their first order.
First opt-in or new lead to purchase.
For lead-based funnels, how long between someone becoming a lead and becoming a buyer, which tells you how much time your nurture sequence actually has to work.
The report shows that buying cycle alongside the value of each first purchase, measured by total, by percent that purchased, and by percent that did not, and you can filter by any element to drill down. Rather than a single blur of "some people buy fast and some buy slow," you get the real shape of your buying cycle, so you can plan around it instead of guessing.
Topics: Wicked Reports Marketing Attribution Sales Velocity buying cycle ad spend decisions
4 min read
Scale Winners Early : Purchase-Timing Attribution
-Aug-17-2026-07-50-17-7939-AM.png)
How to Scale Winning Campaigns Before Your Competitors Do
Most marketers find out a campaign is a winner long after the window to press the advantage has closed. The data trickles in, you wait to be sure, and by the time you scale, the edge is gone. What if you could see which campaigns and which timing were about to pay off, and act on it weeks before your competitors caught on? That is the idea behind Predicted Future, and the timing signals underneath it.
Topics: Wicked Reports customer behavior ad spend optimization purchase timing best time to buy maximize ROI email optimization
5 min read
Drip Attribution: Track Real Email & SMS ROI
DRIP ATTRIBUTION : HOW TO TRACK THE REAL ROI OF YOUR DRIP EMAIL AND SMS
Drip is a capable email and SMS automation platform, especially popular with businesses selling courses, ebooks, software and consulting. It is good at sending and automating. What it cannot do on its own is tell you which of your ads and campaigns actually created the subscribers who went on to buy, or how much revenue your Drip flows truly drove across the full customer journey. For that you need attribution that connects Drip to your real sales across every channel. Here is how to track the real ROI of your Drip marketing.
Topics: Wicked Reports Drip Marketing Attribution Marketing Automation email attribution
5 min read
6 Ways to Improve Email Performance and Real ROI
-Aug-04-2026-08-03-19-4389-AM.png)
6 WAYS TO IMPROVE EMAIL PERFORMANCE AND REAL MARKETING ROI
You have a segmented list and a good offer. You write compelling copy. You send the email hoping it brings in business. But if you stop there, you are missing a few simple steps that would make your email broadcasts measurably more profitable. For small and medium businesses, email is one of the most important lead and revenue engines you have, so it is worth fine-tuning. Here are six ways to do it, all built on measuring what actually drives revenue rather than what looks good on the surface.
Topics: Email Marketing Wicked Reports Email ROI email performance revenue per email
6 min read
ClickFunnels Attribution : Track Real Funnel ROI
.png)
CLICKFUNNELS ATTRIBUTION : HOW TO TRACK REAL ROI FROM YOUR FUNNELS
ClickFunnels is brilliant at building funnels and capturing optins. What it was never built to do is tell you which ad actually created the customer on the other end of that funnel. Its own reporting sees the optin and the sale it can directly observe but it cannot see the weeks-long multi-channel journey that led there. If you are running paid traffic into ClickFunnels and judging performance on what the funnel or the ad platform reports you are almost certainly misreading what works. Here is how to track the real ROI of your ClickFunnels funnels.
A NOTE FOR ANYONE COMING FROM OLDER GUIDES
If you have read older articles about integrating Wicked Reports with ClickFunnels through Actionetics or Follow-Up Funnels those features no longer exist. ClickFunnels rebuilt the platform as ClickFunnels 2.0 and retired Actionetics entirely. The integration described here reflects the current ClickFunnels 2.0 reality not the classic setup.
Topics: Wicked Reports Click Funnels customer lifetime value Marketing Attribution full funnel attribution
5 min read
Cohort Analysis: Tracking Long-Term Revenue and LTV
-Aug-17-2026-08-31-12-7170-AM.png)
Cohort Analysis: How to Track the Long-Term ROI of Your Leads
Here is a problem every marketer eventually runs into. You run a one-month campaign around a special offer. You can see how many leads it generated and how much revenue came in that month. But nine months later, the customers from those leads are still buying, still bringing in money. So what was that campaign actually worth? Not the first month's revenue, but the full value of the customers it brought in, measured over time. Answering that question is what cohort analysis is for.
Topics: Wicked Reports Cohort Analysis Report marketing attribution ROI roi attribution Ad ROI Optimization
3 min read
Wicked Reports FAQ : Setup, Onboarding & the 3x Guarantee
-3.png)
WICKED REPORTS FAQ : YOUR MOST COMMON QUESTIONS, ANSWERED
Now and again we like to share the questions people ask us most about Wicked Reports. These come from folks just like you, who want to make smart, data-driven decisions for their business. Here are the answers.
Topics: Wicked Reports FAQs Marketing Attribution Wicked Reports onboarding
5 min read
The Wicked Reports ROI Report : See What Marketing Earned
-1.png)
THE WICKED REPORTS ROI REPORT : SEE WHAT YOUR MARKETING ACTUALLY EARNED
Most marketing metrics tools still expect you to do the heavy lifting. They will give you numbers, as long as you handle the coding, tracking, filtering, and analysis yourself. That is like a restaurant serving you dinner only if you do the kitchen prep. So ask yourself two questions.
If a CMS will write HTML for you, a CRM will manage your pipeline, and Google and Meta optimize bids automatically, why do you still put up with a reporting tool that makes you become a data analyst before you can see a result? And do you really want to spend your time mastering data analysis instead of growing your business?
Topics: Wicked Reports ROI Report WickedSmartz marketing ROI Full-Impact Attribution
4 min read
Why CPC Is the Wrong Metric to Optimize For
-Aug-13-2026-07-01-06-1575-AM.png)
Three Reasons Cost Per Click Is Costing You Money
Most marketers still judge their ad campaigns on cost per click. It has been best practice forever, and for a long time it was the only number that gave you any quantitative handle on whether your advertising was working. The problem is that the way it has always been done is not the best way, and with CPC it is not even the cheapest one. Optimizing for cost per click quietly costs you money. Here are the three reasons why, and what to measure instead.
Topics: cost per click Wicked Reports ROI LTV LTV calculation LTV data cpc data
5 min read
Facebook Custom Conversions : How They Work
-3.png)
FACEBOOK CUSTOM CONVERSIONS : HOW THEY WORK, AND WHAT THEY STILL CANNOT TELL YOU
Facebook Custom Conversions let you define and optimize for a specific action that matters to your business, rather than relying only on Meta's standard events. They are genuinely useful, and they are still part of the setup in 2026. But the world around them has changed completely since most guides were written, and the honest truth is that even a perfectly configured Custom Conversion only ever measures what Meta itself can see. Here is how they work now, and where you still need to look beyond them.
Topics: Wicked Reports conversion tracking Meta Ads • Conversions API facebook custom conversions
4 min read
When Is the Best Time to Send Your Emails?
-4.png)
When Is the Best Time to Send Your Emails?
Search "the best time to send emails" and you will find a hundred articles giving you the same answer: Tuesday at 10am, or maybe Thursday afternoon, based on some giant industry study. Here is the problem with all of them. That advice is an average of millions of other companies' audiences, and your customers are not the average. The genuinely best time to send your emails is not a number from a benchmark report. It is the time your specific customers actually buy. Here is why that matters, and how to find it.