You probably know that Facebook advertising is one of the best ways to get more sales for your business. In fact 3,750,000 online business owners now use Facebook to acquire their customers. One issue with Facebook Advertising data, however, is that it’ doesn't give you the “complete picture.” Let me explain.
A Few Important Questions
When you advertise on Facebook, you receive only 28 days worth of data. You might think that's no problem because most of your customers buy within 28 days of their first contact with your business. But, let me ask you a few questions. Pay attention to how many you can answer truthfully:
- Should your Facebook Ad get credit for a sale when someone clicks on your Facebook Ad, leaves your site, and then comes back five, ten or twenty days later to buy via Email, organically or via AdWords?
- Which one of your Facebook ad images gives you the highest ROI based on the audience it’s being served to? For example, do you know which image works best for Audience A, B, C and D? The data might surprise you.
- What is the Lifetime Value of each one of your Facebook Audiences?
- What is the Lifetime Value of a customer who sees Ad Image #1, versus the other set of customers that see Ad Image #2 within an audience?
- Which one of your Facebook Ads is giving you at least 100% ROI?
- What about finding “advertising outliers” that are giving you 500%, 600% and even 1,000% ROI. Do you truly know which one of ads are performing the best?
As you can see, you might not be able to answer these advertising questions confidently if you’re relying solely on Facebook for your marketing data.
The Real World
Let’s explore a real world-example of how one client increased his Facebook Ads ROI by 611% using a tool called Wicked Reports.
Before using Wicked Reports, Mark Murrell had a -93.7% ROI on Facebook Ads for his company, Get Maine Lobster. After using Wicked Reports, he was able to more than quadruple his Facebook Ad ROI across the board. Today, he only runs ads that show at least an ROI of 200% or above. How did he do it?
The answer is simple. He analyzed all of his advertising data, stopped funneling money into losing ads, and took that money and put it into winning ads. This simple strategy is very effective because:
- He’s no longer wasting money on ads that don’t provide him with a high ROI
- He has more money to put into ads that have an ROI above 200%, which increases the effectiveness of each dollar spent.
Now you’re probably thinking, “This is great. Now show me how I can do this for my business!”
Performance Over Time
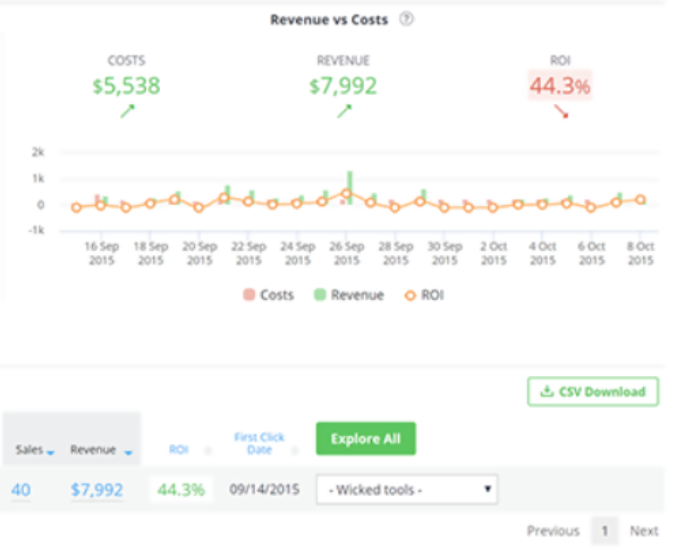
As you can see from the image below, Mark was spending money on the “$100 off 6 Select Products” ad. That ad, which was being served to the “Likes Harry David” audience, returned only a 42% ROI.
From the next image, however, you can see that the same ad and offer of “$100 off 6 Select Products” to a different audience had a 777% ROI!
The moral of this story is simple: Unless you really dig deeply into your data, you will have no idea how certain ads perform with specific audiences over time. Wicked Reports can show you that data. We can even filter data by Offer/Ad Name.
Now let’s look at the “$100 off 6 Select Products” ad because we know that it did really well for one audience and not so well for another.
Increasing Revenue with Positive ROI
As you can see, Mark is running the “$100 off 6 Select Products” ad to six audiences on Facebook. Three of these audiences are profitable, and three are not. Now, Mark simply took all of the money out of the bottom three (negative ROI) audiences and put that money into the three top-performing ads. Doing this saved him $1,200 in advertising spend.
By taking the $1,200 he was spending on losing ads and putting it into one of the positive ROI audiences seen above, like the “Lookalike-GML-Customers-Jan-May-2015” audience, he could make an additional $6,144 in revenue. (512% x $1,200)
Would this type of data be valuable for your business? We think so, but only if you want to make more money of course.
But Wait! There’s More!
Mark also knows that for people who visit his website and abandon their cart, the “$100 off 6 Select Products” ad is not a good offer. Just look under the “Audience / Ad Set Name” column in the previous image and find the “abandoned-cart” audience. Mark is -100% ROI for that audience and ad. If Mark wants to look at what offer is converting for his abandoned cart segment, Wicked Reports can filter by Audience/Ad Set as well.
Let’s look at what offers are converting best for Mark’s Abandoned Cart website visitors.
As you can see from the image above, Mark’s offer of “Nov Tails Buy 6 Get 6” is by far his best-converting offer for Abandoned Cart website visitors. The ROI for that offer is 611%!
The next best offer is only delivering an ROI of 202%. That's not a bad return but we would rather have a 611% return on our money, Wouldn't you?
Saving Money and Making Money
As you can see, Mark gets a lot of value from Wicked Reports to make decisions about his advertising. Not only has Mark saved thousands of dollars in ad spend by using Wicked Reports, he’s also added $800,000 in profit to his business. If can make decisions like that, you can afford a few lobster dinners of your own.
We've only really scratched the surface for all of the cool marketing data that Wicked Reports has to offer. If you’d like to dive deeper, click here to get a copy of our in-depth case study and learn tow Get Maine Lobster clawed $8,654 from their ad spend and increased Facebook ads ROI by more than 611%.