-3.png)
HOW TO USE THE SALES VELOCITY REPORT TO MAKE SMARTER AD DECISIONS
One Wicked Reports customer almost canceled his most profitable Facebook campaign. He was measuring response every week, and on that timeline only 4.4% of new leads from those ads had purchased, so the campaign looked like a loser. But more than half his leads took over a week to buy, and over time those ads generated more than $800,000 in revenue on $125,000 of spend. Measuring weekly nearly cost him his best campaign. Measuring the real buying cycle saved it.
That is the entire point of the Sales Velocity Report. It answers a question most advertisers cannot answer, and the answer decides whether you scale profitably or bleed budget. How long does it actually take your leads to buy? 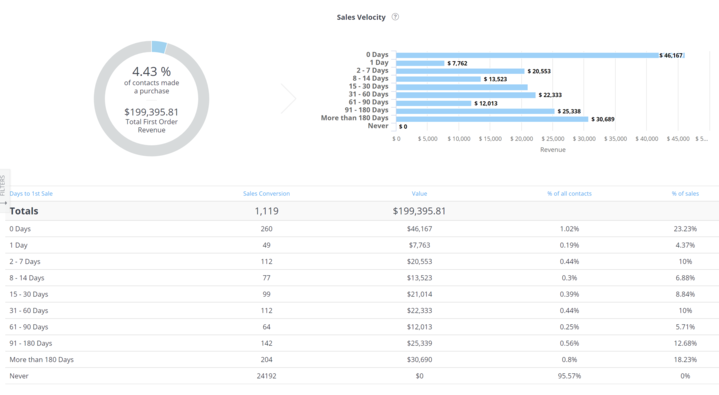
WHAT SALES VELOCITY ACTUALLY MEASURES
Sales velocity is the time it takes a lead to become a customer, measured from a real starting point such as first click or first opt-in through to the purchase. The Wicked Reports Sales Velocity Report shows you that timing across your customers, broken down by the milestones that matter.
First click to purchase.
How many days, on average, between a customer's very first interaction with you and their first order.
First opt-in or new lead to purchase.
For lead-based funnels, how long between someone becoming a lead and becoming a buyer, which tells you how much time your nurture sequence actually has to work.
The report shows that buying cycle alongside the value of each first purchase, measured by total, by percent that purchased, and by percent that did not, and you can filter by any element to drill down. Rather than a single blur of "some people buy fast and some buy slow," you get the real shape of your buying cycle, so you can plan around it instead of guessing.
WHY THIS IS THE MISSING NUMBER IN MOST AD DECISIONS
The most expensive mistake in paid media is judging a campaign before it has had time to work. It happens constantly. A campaign launches, a week passes, the sales are not there yet, and it gets cut. But if your real buying cycle is two or three weeks, those sales were always going to arrive later. You did not kill a losing campaign, you killed a winner that had not finished converting, exactly what nearly happened to that Facebook campaign above.
The Sales Velocity Report removes the guesswork from that call in three ways.
It tells you how long to wait before judging. If your data shows most customers buy within 21 days of first click, you know not to make a scale-or-kill decision on day three. You give every campaign at least one full buying cycle to prove itself.
It sets your attribution and reporting windows correctly. If your velocity is three weeks and your reporting window is seven days, you are structurally guaranteed to undercount your results. Match the window to the real cycle.
It times your follow-up and budget pacing. Knowing when customers typically convert tells you when your email and retargeting pressure should peak, and when this month's ad spend will actually show up as revenue, so a normal lag does not spook you into cutting.
DIFFERENT SOURCES HAVE DIFFERENT VELOCITIES
Here is where it gets genuinely useful for allocation. Buying cycles are not uniform, they vary by source, campaign, audience, and offer. Leads from a cold awareness ad might take a month to buy, while branded search converts in a day. If you judge both on the same short timeline, the slow-but-valuable source looks like a failure and you cut it, when it may be bringing in your highest lifetime value customers.
Seeing velocity by source lets you judge each channel on its own real timeline, and pair that with lifetime value to find the sources worth waiting for. You want to stick with the money-making channels even if it takes longer for the money to come in. A slower cycle is not a worse cycle if those customers are worth more.
WHY YOU CANNOT GET THIS FROM THE AD PLATFORMS
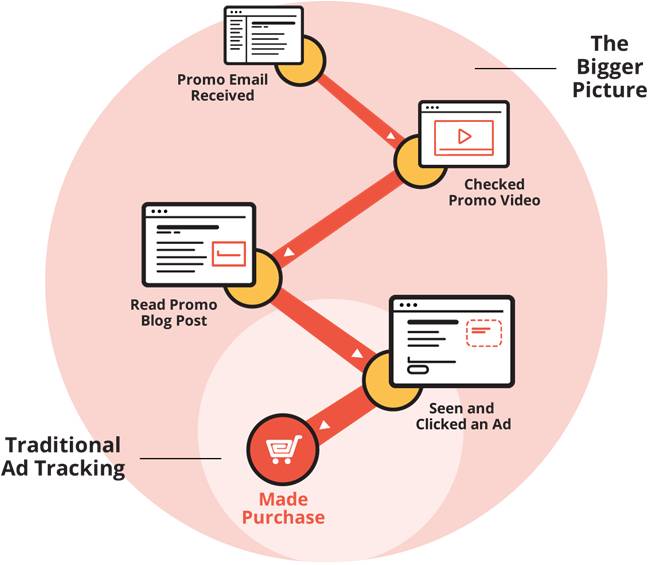
Ad platforms cannot show you true sales velocity, for the same reason they cannot show you true ROI. They only see their own touchpoints inside a short attribution window, and they lose the customer who takes weeks to buy or who converts on another device or channel. Google sees a click and, three weeks later, has no idea the sale it is now missing traces back to it. Every platform grades its own homework on a timeline far too short for how people really buy. Last-click attribution especially cannot tell you the customer's history, when they opted in, or how many times you reached them between first opt-in and first purchase.
Measuring real sales velocity means connecting each customer's first click or opt-in to their eventual purchase, however long the gap, reconciled against your actual order data across every channel. That is what the Sales Velocity Report is built on, and it pairs naturally with cohort analysis, which shows how those customers' value grows after that first purchase, and with buying-cycle planning, which turns the timing into action. (For more on reading your buying cycle, see our guide on predicting your customers' buying cycle.)
MAKING THE DECISION
Put it together and the scale-or-kill call gets simple. Give every campaign at least one full buying cycle, measured by its real velocity, before you decide. Judge slow sources on their own timeline and against the lifetime value they produce, not against your fastest channel. Set your windows to match reality. Then scale the campaigns that bring in valuable customers, even if those customers take a while to arrive, and cut the ones that genuinely do not convert once the cycle is complete.
Want to see your real buying cycle by source, and stop killing campaigns before they pay off? See how it works in the platform overview, or book a demo to see it on your own data.
FAQ
WHAT IS SALES VELOCITY IN MARKETING?
Sales velocity is the time it takes a lead to become a paying customer, measured from a starting point like first click or first opt-in through to purchase. Knowing it is essential for judging campaigns correctly, because it tells you how long to wait before deciding whether a campaign is working rather than cutting it prematurely.
HOW DOES THE SALES VELOCITY REPORT HELP ME SCALE ADS?
It shows how long your customers actually take to buy, by source, so you give each campaign a full buying cycle before judging it, set your reporting windows to match reality, and time your follow-up correctly. That stops you killing slow-but-profitable campaigns and helps you scale the ones bringing in valuable customers even when they convert later.
WHY DO MARKETERS KILL CAMPAIGNS TOO EARLY?
Because they judge campaigns on how fast the platform reports rather than on how long their customers really take to buy. If your buying cycle is three weeks, a campaign that looks dead at day three may be a strong performer by day 30. Measuring your true sales velocity tells you exactly how long to wait before making the call.
WHY CAN'T AD PLATFORMS SHOW ME TRUE SALES VELOCITY?
Because they only see their own touchpoints within a short attribution window and lose customers who take weeks to convert or who buy through another channel or device. Measuring true velocity requires connecting each customer's first click or opt-in to their real order across the full journey, which needs first-party, cross-channel attribution rather than a single platform's view.