Analyze Lead Groups: Using Cohort Analysis to Measure Long-Term ROI
Imagine this scenario:
Your marketing team creates a program around a special offer that runs for one month. You want to know, of course, how many leads the program generated and how much revenue those leads brought in. Nine months later, however, you know that customers from those same leads have continued to buy, bringing in even more money.
 But which customers? And did they optin because of the Facebook ads, the Google ads or the emails? Among those lead sources, which messages worked best? You need to see the details and, even more important, which leads were most profitable.
When you think about the work involved to pull that data, however, you want to tear your hair out. You have to consolidate information from multiple reports, try to slice revenue by data range and lead source, then double check the attributions to eliminate duplicates. You know this project is going to take hours—and it’s your anniversary. No working late tonight!
Relax, Wicked Reports makes analyzing this lead group a piece of cake.
Our mission is to simplify the analysis of marketing metrics and improve your marketing efficiency. As part of that effort, Wicked Reports has released our newest way to analyze lead ROI: the Cohort Analysis Report.
This report gives customers a quick way to see the value of a lead cohort both for a specified period and over time. It is the fastest way to learn which defined lead sources from a group to optimize and which to cancel based on how much actual revenue they generated.
Analyzing a Lead Cohort
A cohort is a group of new leads, determined by when they opted in and what click got them to opt in. The Cohort Analysis Report lets you understand how much money specified leads generated over a specific date range—as well as how much they continued to spend over time.
With the Cohort Analysis Report, you see:
- All the leads that opted in during a defined time frame because they clicked on the same ad.
- How much money the cohort of leads spent during the selected time frame.
- How much money those people spent cumulatively in the future: one month later, three months later, etc.
- Which of those lead sources had a positive or negative ROI.
If that sounds complicated, relax; Wicked Reports makes this really, really easy.
For a quick view of the Cohort Analysis Report and how it works, just watch this short video that takes you through the Cohort Analysis Report step by step and shows you how it works.
https://scottd71.wistia.com/medias/y251li9una
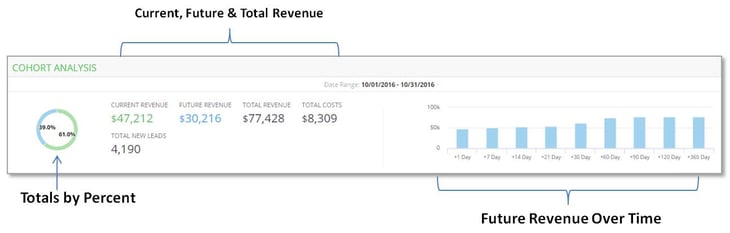
The Data Summary
To use the Cohort Analysis Report, just set the relevant parameters, like date range and lead source(s). Wicked Reports does the rest. Here’s what you see in summary and graphically at the top of the report:
- Total New Leads – the new leads generated by this data source in the specified time frame
- Total Costs – the cost of the campaign or program
- Current Revenue – the revenue generated by these leads during the specified time frame
- Future Revenue – the cumulative revenue generated over time since the end of the specified time frame
- Total Revenue – the total revenue generated by this lead source since the beginning of the specified time frame
A bar chart shows you how the revenue grows over time and a doughnut chart displays current and future revenue by percent.
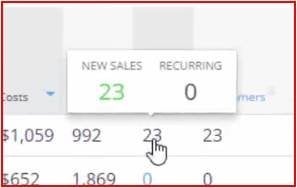
The Details by Lead Source
Dropping into the Cohort Analysis Report details, you see current, future, and total revenue broken down by every ad, email, or other data source. You don’t even have to calculate which data sources worked best because a separate column, Wicked Advice, tells you whether the ROI for that data source is positive or negative.
Once you see the Cohort Analysis Report, you’ll understand why so many Wicked Reports customers requested it. And when our customers speak, we listen. With Wicked Reports doing the hard work, you can go out for your anniversary, make it to that soccer game, catch the movie you want to see, or just kick back and relax instead of ordering pizza to your office -- again.
Don’t wait. Check out the Cohort Analysis Report and see what it can do to make your job—and your life—easier.
To get more information about Wicked Reports, watch a live demo. You’ll wonder how you ever did without it.