


Scott Desgrosseilliers
Recent posts by Scott Desgrosseilliers
6 min read
Halo Modeling Deep Dive: Credit for Views, Not Just Clicks

Maybe you've had this experience. You run ads across multiple channels, and a big share of the budget goes to video: TikTok, YouTube, Meta video at the top of funnel.
People don't click those ads much. They watch, then later they open Google and search your brand name. The click attribution goes to whatever got clicked last: Google brand, Microsoft brand, organic search, or in the worst case the order comes through completely unattributed.
The video that actually started the sale gets no credit. But you know it's working, because when you stop running those campaigns, revenue drops. When you scale them, it climbs. The clicks just never told that story.
Halo Modeling resolves that conflict. It gives credit back to the channels that earn attention but don't collect clicks, and unlike every black-box approach out there, it shows you exactly how.
Topics: Wicked Reports New Customer Acquisition Cost (NCAC) Halo Effect Halo Effect Attribution View Through Attribution
10 min read
The Paid Traffic Truth : The Calm Week Before the Q4 Ramp
.png)
The Paid Traffic Truth — Issue 016
Published October 12,2026 * Data for the week of October 04 to October 10 2026 * Aggregated across hundreds of Wicked Reports accounts.
The Calm Week Before the Q4 Ramp
The first full week of Q4 came in quiet. The two giants are sitting within a few dollars of their September close, click prices have not started climbing, and the baseline numbers from last issue are still the baseline. One channel did not get the memo: Microsoft's new customer cost has now risen four weeks in a row.
This week's number
Meta held at $78 with 92% verified new buyers, its highest new share on record in this series, and its tightest markup over blended CAC at 8%. Google held at $163. The ramp has not arrived.
01 / Introduction
Quiet tape, one exception
Last issue closed out September and said the next structural event on the calendar was the Q4 spend ramp. This week's data says it has not started. Meta moved 1%, Google moved 2%, Meta's click prices actually fell 5%, and the auction pressure everyone is bracing for is still ahead. Quiet weeks are useful precisely because nothing is distorting the numbers.
The exception is Microsoft, covered below, followed by the same four verified grids as every week: new customer acquisition, first click versus last click, overall channel performance, and new customer lifetime value. All first-party, order-verified data aggregated across hundreds of Wicked Reports accounts. No modeling, no surveys.
02 / Analysis
Three lines, one mover
Here are the three largest paid channels over the last four weeks. Two of them are the picture of stability. One is not.
The stability is the headline, even if it does not feel like one. Meta's $78 comes with its strongest quality profile in this series: 92% of its tracked customers verified as first-time buyers and a markup over blended CAC of just 8%, meaning the number you see is almost entirely the cost of real growth. Google's $163 sits three dollars off its September close with conversion flat. Click prices are not climbing anywhere that matters yet. If you took last issue's advice and wrote down your baseline, nothing this week invalidated it, and if you did not, this is the last quiet tape you are likely to get before the ramp.
Microsoft is the counter-trend. Four straight weekly increases, $170 to $207, a 22% climb over the stretch, while its new-buyer share slid from 58% to 55% and its markup over blended CAC hit 80%, the highest of any major channel. The mechanism is murky: this week its click prices fell 4% while conversion dropped 6%, so the deterioration is in what the traffic does, not what it costs. Two honest qualifiers before anyone touches a budget. Microsoft carries 3.4% of tracked spend, so a smaller pool of accounts moves this aggregate more easily than it could on Meta or Google. And four weeks of drift in a small channel is a watch item, not a verdict. If you spend on Microsoft, the move is to pull your own verified number, not to react to the market's.
03 / New Customer Acquisition
The full acquisition picture, by channel
Beyond the headliners: YouTube keeps holding its new range, back down to $366 this week with conversion up 14% and a growing spend share at 4.3%. Five weeks ago that channel cost roughly $630 per new customer, and the reset has now held long enough to treat the low $400s and below as its current level. TikTok swung violently upward this week, which means nothing, exactly as its downward swing meant nothing last week. The AI assistant channel had a soft conversion week but remains one of the highest new-buyer shares in the set at 79%.
04 / First Click vs Last Click
Two models, two different weeks
One measurement note worth connecting to the Microsoft story above. Microsoft's last-click over-credit widened to 0.61 this week, its largest in this series, at the same time its verified new customer cost hit a four-week high. A last-click dashboard shows that channel improving while the verified grid shows it deteriorating. That is not a contradiction, it is two models answering different questions, and only one of them is pricing new customers.
05 / Overall Channel Performance
Where the money goes, and THE TRUE COST OF A NEW CUSTOMER
The Microsoft row is this grid's cautionary tale this week. It posts the best ROAS in the set at 1.70, and it carries an 80% markup between blended CAC and true new customer cost, which means most of what that ROAS is celebrating is repeat demand. A channel can look like your best performer and be your most expensive source of actual growth at the same time. Meta remains the inverse: the worst-looking ROAS at 0.55 and the cheapest verified new customer at $78.
06 / New Customer Lifetime Value
What a new customer becomes over a year
The value side gives Microsoft its fair hearing. A Microsoft new customer is the most valuable paid acquisition in the set at $373 over a year, so even at $207 the channel still pays back on its own click-credited revenue. The four-week climb has not broken its economics, it has thinned them: the spread between one-year value and acquisition cost has narrowed from roughly $195 a month ago to $166 now. The standing caveat applies: this grid blends brands at very different price points, so treat it as a directional market benchmark, not a promise for any one store.
07 / Conclusion
Use the quiet. It will not last.
The market enters mid October with the big baselines intact: Meta near $78 at the strongest new-buyer quality this series has recorded, Google near $163, YouTube settled at roughly half its summer cost, and Microsoft drifting the wrong way on thin volume. BFCM is about seven weeks out, and the auction pressure that will define November has not shown up in click prices yet.
If you recorded your baseline last week, verify it held and move on. If you did not, do it now, because every week from here adds ramp noise to the numbers you are trying to call normal. And if Microsoft is in your mix, pull your own verified nCAC and new-buyer share for the last four weeks specifically. The aggregate says that channel is getting more expensive while looking better on ROAS, and that combination is exactly how a line item earns budget it no longer deserves.
See your own version of these four grids.
Your real nCAC next to your aCAC, your first versus last click gap, your new customer LTV by channel, in your own account.
Get the Paid Traffic Truth Report directly to your inbox.
How this week's numbers were built. Aggregated across hundreds of Wicked Reports client accounts for the week of October 04 to October 10, 2026, except first click vs last click, which uses a rolling 90 day window. New versus repeat is verified at the order level against first party order IDs, not modeled and not surveyed. The new visit to new customer conversion rate credits the channel that originated the new visit. Channels without cost data, including email, SMS, organic, and influencer, are left out of the cost comparisons. Snapchat is excluded for negligible spend. Pinterest is marked with an asterisk because it ran on a small number of new customers this week, so it is not used to anchor any headline. The channel labeled Facebook in the underlying platform data is shown here as Meta. Charts and tables carry meaning through direction, labels, and contrast rather than color alone.
Topics: Wicked Reports New Customer Acquisition Cost (NCAC) Paid Traffic Truth paid media measurement BFCM Q4 Budget Planning Microsoft Ads
4 min read
New customer costs fell $55. Meta missed it.
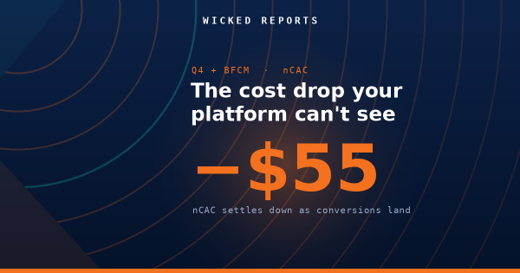
How much does new customer CAC fall after the click month?
New customer acquisition cost is supposed to be a number you can trust on the day you read it. In Q4 it is not, and the size of the gap is the whole story.
Topics: Wicked Reports New Customer Acquisition Cost (NCAC) blended ROAS BFCM Delayed Conversions Meta CAC BFCM
4 min read
The sooner you buy Meta clicks, the more you make
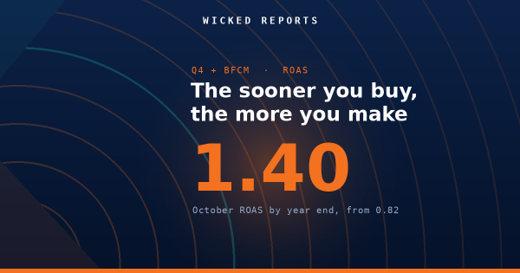
When is the best time to buy Meta clicks in Q4?
If there is one line to plan Q4 around, it is this : the sooner you buy the click, the more money it makes by the time the year closes.
Topics: Wicked Reports meta roas BFCM BFCM ROAS When To Buy Meta Clicks
3 min read
Is the 49% BFCM click premium worth it?
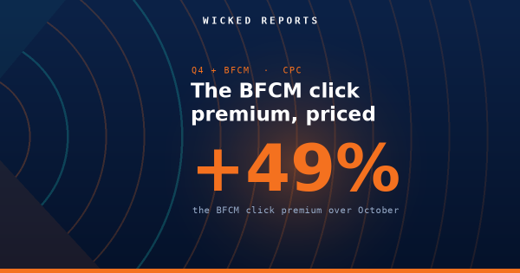
How much more do Meta clicks cost on BFCM?
Every Q4 you watch your Meta cost per click climb, and every Q4 you wonder whether the BFCM premium is worth paying. Here is the 2025 answer, with the numbers.
Topics: Wicked Reports BFCM BFCM CPC Meta CPC BFCM Ad Premium CPC vs CAC
10 min read
The Paid Traffic Truth : Paid Traffic Enters Q4 Cheaper Than It Left August
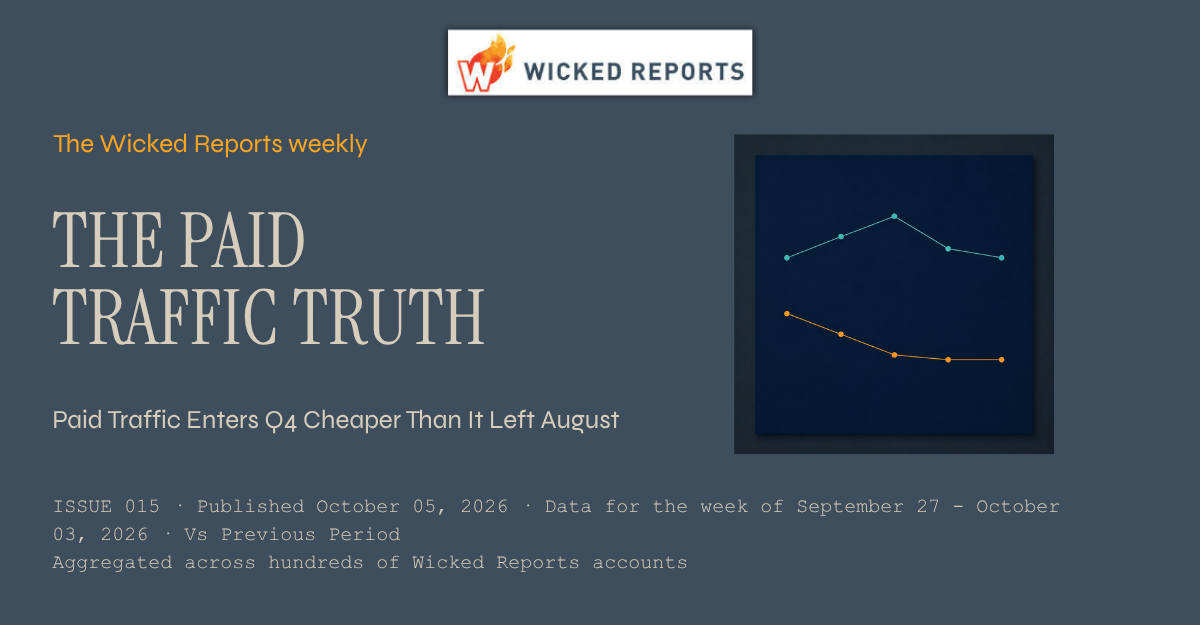
The Paid Traffic Truth — Issue 015
Published October 05,2026 * Data for the week of September 27 to October 03 2026 * Aggregated across hundreds of Wicked Reports accounts.
Paid Traffic Enters Q4 Cheaper Than It Left August
September threw a holiday spike, a month-long Meta slide, and a YouTube reset at the market. Now the month is closed and the noise has washed out, and the net result is simple: the two channels carrying 92% of tracked spend enter Q4 at or below where they ended August. These are the baseline numbers to judge the Q4 ramp against, and the ramp is the next thing coming.
This week's number
The September round trip is complete. Meta enters October at $76, 11% cheaper than late August. Google enters at $160, flat to where it started, with the holiday spike fully unwound.
01 / Introduction
The month closed. Here is where it left you.
This is the first issue of October, so before the weekly grids, this one does something the series has not done before: it closes out a full month. Five weeks of verified data covered the Labor Day run-up, the holiday itself, two clean recovery weeks, and now the first week of Q4 proper. Every one of those weeks moved some channel around. The question that matters for planning is what survived the round trip.
The answer is below, followed by the same four verified grids as every week: new customer acquisition, first click versus last click, overall channel performance, and new customer lifetime value. All first-party, order-verified data aggregated across hundreds of Wicked Reports accounts. No modeling, no surveys.
02 / Analysis
One chart, the whole month
Here is September in a single picture: verified nCAC for the two largest channels, all five weeks.
Two stories ran through September, and they ended differently. Google's story was the holiday: Labor Day pushed its new customer cost from $161 to $179, and three consecutive declining weeks brought it back to $160, with conversion up 3% this week. A complete round trip. If you panicked about Google in mid September or celebrated it this week, you were reacting to the calendar both times.
Meta's story was not the holiday, and that is the part worth carrying into Q4. Its decline ran through the holiday weeks and the clean weeks alike, $85 to $74 over four weeks, before ticking up 2% to $76 this week on softer conversion. One week is a data point, not a reversal, so the honest read is that the slide has stopped and the channel has settled at a level about 11% below late August. The quality held the entire time: 91% of Meta's tracked customers are verified first-time buyers, same as every week this month, with the markup over blended CAC now at 9%. The cause of the slide is still what it was last week, a mix story rather than cheaper auctions, and still unproven. The level itself is verified either way.
Why this matters right now: the Q4 ramp is the next structural event on the calendar. As BFCM spend floods the auctions over the coming weeks, costs will climb, and every brand will face the same question at every weekly check-in: is this seasonal inflation I planned for, or is my account deteriorating? You cannot answer that without knowing precisely where you started. This month-end snapshot is the market's starting line. Yours is in your own account.
03 / New Customer Acquisition
The full acquisition picture, by channel
Beyond the two headliners: Microsoft drifted up again to $191 and has now round-tripped the holiday in the wrong direction, the one major channel entering October more expensive than it entered September. YouTube settled a second week in the low $400s, still well below its August range, with a soft conversion week. TikTok collapsed back to thin-data status with a new-buyer share that fell to 51%, its fourth violent swing in four weeks, which is exactly why thin channels never anchor a conclusion here.
04 / First Click vs Last Click
Who starts the sale vs who takes the bow
This grid is a measurement reconciliation, not an investment case. It explains why the platforms' own dashboards disagreed with the verified numbers all month: last click shifts credit from the channels that open journeys toward the channels that close them, so a last-click view understated Meta's September and flattered the search channels. When you compare your Q4 numbers against a baseline, make sure both were measured under the same model, or the comparison is meaningless before you start.
05 / Overall Channel Performance
Where the money goes, and THE TRUE COST OF A NEW CUSTOMER
The standing pattern survives the month-end accounting intact. Google's ROAS is 2.7x Meta's, and a new customer still costs 111% more there, because its 54% markup between blended CAC and true new customer cost is repeat demand doing the flattering. Meta's 9% markup is the tightest in the grid. Whatever the Q4 auctions do to these numbers, the ROAS column will keep ranking the channels in the wrong order for growth, and that does not change with the season.
06 / New Customer Lifetime Value
What a new customer becomes over a year
The value side barely moved all month, which is the point of this grid. Acquisition costs swung with the calendar while what a new customer becomes stayed steady: Meta's one-year value sat within a few dollars of $108 every week, Google's near $243. That stability is what makes the cost side plannable. Your Q4 question is not whether customers will be worth less, it is what you will pay to get them. The standing caveat applies: this grid blends brands at very different price points, so treat it as a directional market benchmark, not a promise for any one store.
07 / Conclusion
Write down your starting line this week
The market enters Q4 with Meta around $76 and 11% cheaper than late August, Google flat at $160, Microsoft slightly elevated, and YouTube settled well below its summer range. Clean entry conditions, about eight weeks out from BFCM, with the spend ramp ahead of it.
The move this week takes twenty minutes. Pull your own verified September numbers per channel, nCAC and new-buyer share, and write them down as your Q4 baseline before October data starts piling on top of them. Then judge every week of the ramp against that line. When your Meta nCAC reads 30% higher in early November, the baseline is what tells you whether that is the seasonal inflation everyone pays or a problem that is yours alone. Brands that skip this step spend November arguing about numbers nobody wrote down in October.
See your own version of these four grids.
Your real nCAC next to your aCAC, your first versus last click gap, your new customer LTV by channel, in your own account.
Get the Paid Traffic Truth Report directly to your inbox.
How this week's numbers were built. Aggregated across hundreds of Wicked Reports client accounts for the week of September 27 to October 03, 2026, except first click vs last click, which uses a rolling 90 day window. New versus repeat is verified at the order level against first party order IDs, not modeled and not surveyed. The new visit to new customer conversion rate credits the channel that originated the new visit. Channels without cost data, including email, SMS, organic, and influencer, are left out of the cost comparisons. Snapchat is excluded for negligible spend. Pinterest is marked with an asterisk because it ran on a small number of new customers this week, so it is not used to anchor any headline. The channel labeled Facebook in the underlying platform data is shown here as Meta. Charts and tables carry meaning through direction, labels, and contrast rather than color alone.
Topics: Wicked Reports New Customer Acquisition Cost (NCAC) Meta Ads Paid Traffic Truth paid media measurement BFCM Q4 Budget Planning
3 min read
The $55 nCAC drop Meta never showed you
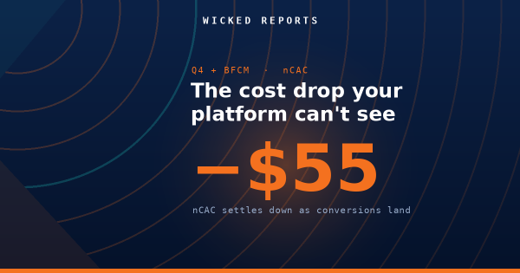
New customer acquisition cost is supposed to be a number you can trust the day you read it. In Q4 it is not, and the size of the gap is the whole story.
Topics: Wicked Reports New Customer Acquisition Cost (NCAC) blended ROAS BFCM Delayed Conversions Meta CAC BFCM
4 min read
Why Meta customers gain $112 after the click
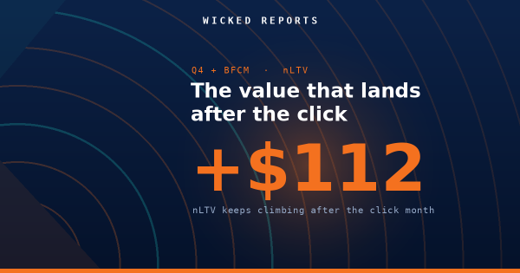
How much new customer value lands after the click month?
If you graded your October Meta spend on the numbers your ad platform showed you in October, you graded it months too early.
Topics: Wicked Reports BFCM nLTV Cohort New Customer LTV Meta Attribution Lag Click Level Attribution
10 min read
The Paid Traffic Truth : Why Meta's New Customer Cost Fell Four Weeks Straight
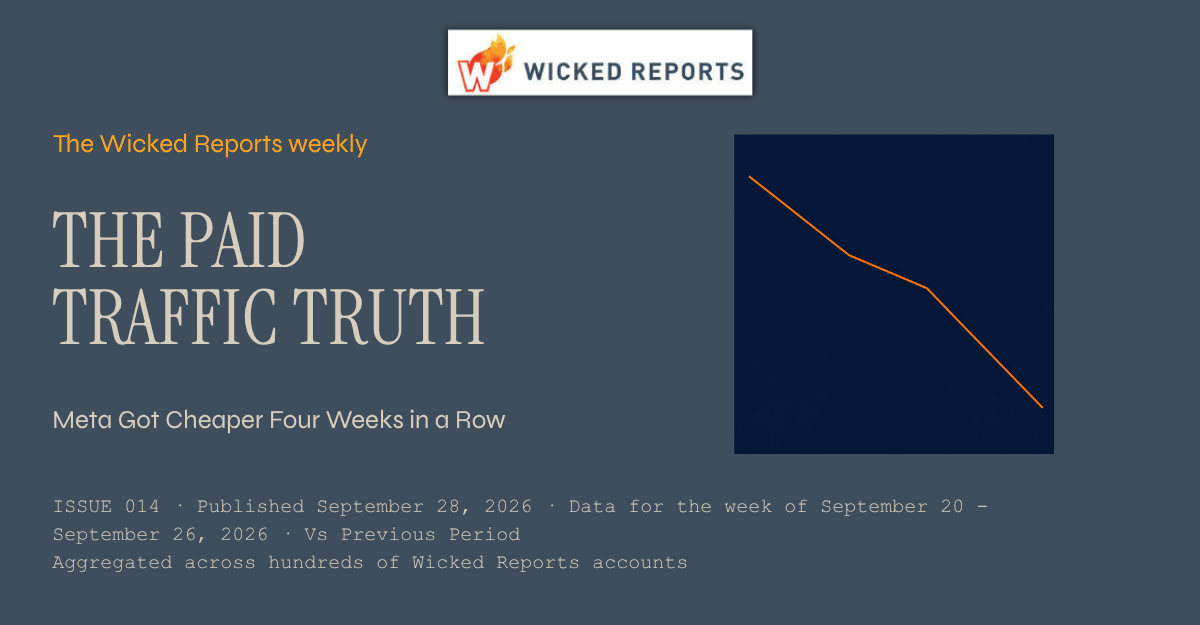
The Paid Traffic Truth — Issue 014
Published September 28,2026 * Data for the week of September 20 to September 26 2026 * Aggregated across hundreds of Wicked Reports accounts.
Meta Got Cheaper Four Weeks in a Row
September's noise was the holiday. September's signal was Meta. While the other channels bounced around Labor Day and back, the verified cost of a new customer on Meta fell every single week of the month, and it is doing it with the highest share of genuinely new buyers of any channel. If you are setting Q4 budgets on last quarter's Meta numbers, they are already stale.
This week's number
Meta's verified nCAC fell a fourth consecutive week to $74, down from $85 a month ago, a 13% decline at a steady 91% new-buyer share.
01 / Introduction
The quietest trend of the month is the biggest one
For three issues running, Meta's falling new customer cost has been a side note while louder stories took the headline. It has now earned the headline. Four weeks, four declines: $85, $82, $78, $74. On the channel carrying half of all tracked spend in this data set, that is not a footnote. That is the market moving.
This issue looks at what is behind the run and what it should change about Q4 planning, then walks the same four verified grids as every week: new customer acquisition, first click versus last click, overall channel performance, and new customer lifetime value. All first-party, order-verified data aggregated across hundreds of Wicked Reports accounts. No modeling, no surveys.
02 / Analysis
Four weeks down, and the new-buyer share never budged
A falling acquisition cost is only good news if the customers are real. The first thing I checked across all four weeks is the quality of what Meta is delivering, and it held. The share of Meta's tracked customers who are verified first-time buyers stayed at 90% to 91% the entire month, the highest of any channel, and the markup between blended CAC and true new customer cost stayed pinned at 10% to 11%. The decline is not repeat buyers sneaking into the mix and dragging the average down. Meta is buying genuinely new customers, and the price keeps dropping.
The holiday question is the obvious objection, and the chart answers it. The first two declines happened during the Labor Day run-up and the holiday week itself, when discovery channels always get a temporary discount, and I said at the time not to treat that cheapness as a baseline. But the holiday unwound weeks ago. Search costs snapped back. Meta kept falling anyway, through two clean weeks, which is what separates a calendar effect from a trend.
What I cannot yet give you is the cause. This week's decline came with conversion nearly flat and click prices nearly flat, so the drop is not better auction prices and not better site conversion. That points to mix: which accounts, campaigns, and products the spend is flowing through. One candidate worth naming is that Meta's share of tracked spend has drifted down for three straight weeks, from 53.5% to 50.1%, and when marginal dollars leave a channel, the budget that remains tends to be concentrated in its strongest campaigns, which improves the average. That is a hypothesis, not a finding. The trend is verified. The mechanism is not, and I would rather tell you that than invent a clean story.
03 / New Customer Acquisition
The full acquisition picture, by channel
Elsewhere in the grid: Google settled a second week at $167 with conversion up 4%, so search is back to its normal shape after the holiday. YouTube gave back part of last week's big drop, landing at $430 with 76% new buyers, still well below its August range of roughly $800, and worth continued attention. Microsoft had an odd week, with conversion up 5% but click prices up 9%, pushing its nCAC to $186. TikTok whipsawed downward again and returns to thin-data status, which is why I do not trade on its weekly reads.
04 / First Click vs Last Click
Who starts the sale vs who takes the bow
The Meta row is the reason a month-long trend like this stays invisible on most dashboards. Meta is under-credited on last click, so a chunk of the new customers it keeps acquiring more cheaply gets booked to whatever search ad closed the journey. If your reporting runs on last click, your Meta improved all month and your dashboard split the credit with Google.
05 / Overall Channel Performance
Where the money goes, and THE TRUE COST OF A NEW CUSTOMER
The standing pattern holds even in Meta's best month. Google posts a ROAS of 1.32 against Meta's 0.51, and a new customer still costs 126% more on Google. The 56% markup between Google's blended CAC and its true new customer cost is repeat demand doing the flattering. Meta's 10% markup means the cheap number on its row is almost entirely new business. If Q4 budgets get set on the ROAS column, the money moves in exactly the wrong direction.
06 / New Customer Lifetime Value
What a new customer becomes over a year
The LTV grid shows why the four-week run matters more than a discount usually would. Meta has always been the thin-margin channel in this data set: a low first order that grows to $108 at one year, against an acquisition cost that used to leave little room. A month ago that spread was $111 of value against $82 of cost. This week it is $108 against $74. Same value curve, meaningfully more margin. The standing caveat applies: this grid blends brands at very different price points, so treat it as a directional market benchmark, not a promise for any one store.
07 / Conclusion
Re-pull your Meta number before you lock Q4
Black Friday budgets are being finalized right now, and most of them are being built on Meta nCAC assumptions from July or August. This data says the market's number has moved 13% in a month. If your plan still carries the old figure, your Q4 model is conservative in the one place you might not want it to be, and if you are pacing spend to a target nCAC, you may be leaving volume on the table at a price you would happily pay.
The move this week: pull your own verified Meta nCAC for September, not the platform-reported number, and check it against whatever figure is sitting in your Q4 plan. Then check your new-buyer share alongside it, because a cheap Meta number only helps if it is buying new customers rather than recycling old ones. The aggregate trend is real, but your account is not the aggregate, and the only version of this number worth planning on is your own.
See your own version of these four grids.
Your real nCAC next to your aCAC, your first versus last click gap, your new customer LTV by channel, in your own account.
Get the Paid Traffic Truth Report directly to your inbox.
How this week's numbers were built. Aggregated across hundreds of Wicked Reports client accounts for the week of September 20 to September 26, 2026, except first click vs last click, which uses a rolling 90 day window. New versus repeat is verified at the order level against first party order IDs, not modeled and not surveyed. The new visit to new customer conversion rate credits the channel that originated the new visit. Channels without cost data, including email, SMS, organic, and influencer, are left out of the cost comparisons. Snapchat is excluded for negligible spend. Pinterest is marked with an asterisk because it ran on a small number of new customers this week, so it is not used to anchor any headline. The channel labeled Facebook in the underlying platform data is shown here as Meta. Charts and tables carry meaning through direction, labels, and contrast rather than color alone.
Topics: Wicked Reports New Customer Acquisition Cost (NCAC) Meta Ads Paid Traffic Truth paid media measurement Q4 Budget Planning Verified Attribution
10 min read
The Paid Traffic Truth : Why YouTube's New Customer Cost Just Reset
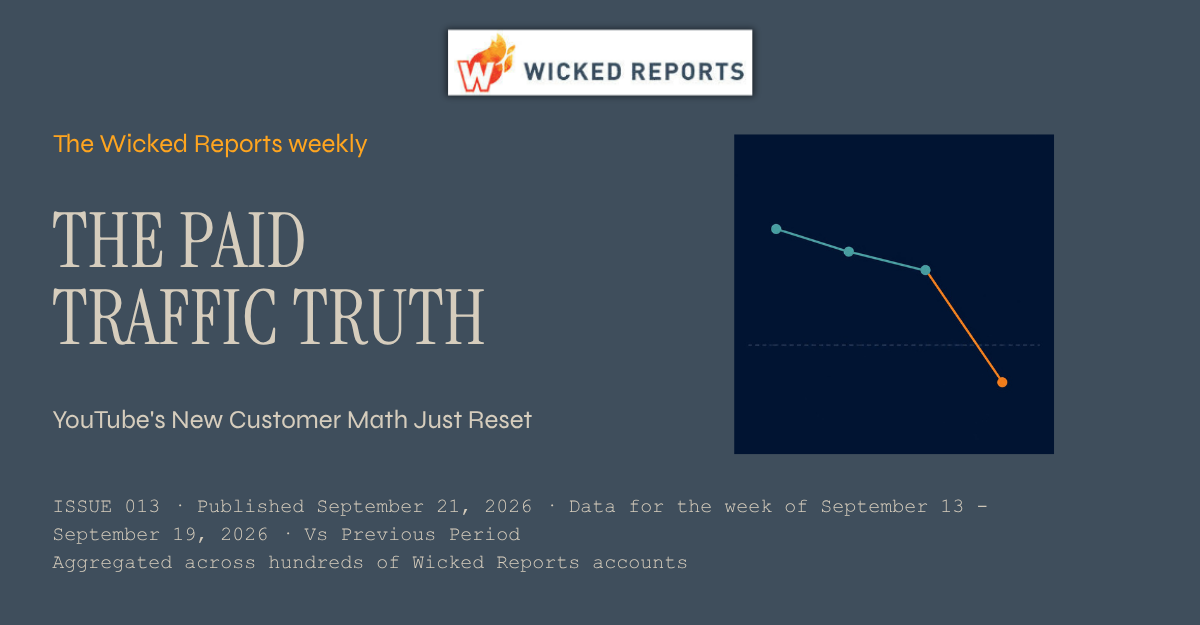
The Paid Traffic Truth — Issue 013
Published September 21,2026 * Data for the week of September 13 to September 19 2026 * Aggregated across hundreds of Wicked Reports accounts.
YouTube's New Customer Math Just Reset
Everyone spent September watching Meta and Google trade holiday effects. Meanwhile the biggest verified move of the week happened on the channel most brands wrote off as unmeasurable. YouTube's cost of a new customer fell by nearly half, and the give-back from the holiday only explains part of it.
This week's number
YouTube's verified nCAC fell 43% in one week, from $629 to $360, while new visit to customer conversion rose 54% and its new-customer share jumped from 56% to 79%.
01 / Introduction
First, the receipt. Then the actual news.
Last issue ended with a prediction: the Labor Day effect would give something back, and I would report it either way. Here is the scorecard. Search snapped back on cue, with Google's nCAC down 4% to $172 and conversion up on both Google and Microsoft. Meta, meanwhile, never gave anything back. Third straight week of falling new customer cost, now at $78. The full grids are below.
But the real story of the week is not the two channels everyone watches. It is the one most brands quietly gave up on measuring. This issue tells that story, then walks the same four verified grids as always: new customer acquisition, first click versus last click, overall channel performance, and new customer lifetime value. All first-party, order-verified, aggregated across hundreds of Wicked Reports accounts. No modeling, no surveys.
02 / Analysis
Video's quiet reset, and how much of it is real
Three YouTube numbers moved together this week, and the combination matters more than any one of them. Verified nCAC fell 43% to $360. New visit to customer conversion rose 54%. And the share of YouTube's tracked customers who are genuinely new jumped from 56% to 79%, which pulled its markup over blended CAC down from 79% to 25%. Click prices were flat. This was not YouTube getting cheaper to click. It was YouTube traffic converting better and skewing much harder toward first-time buyers.
Why does this matter beyond one channel's good week? Because YouTube is the channel where the measurement excuse runs deepest. Views happen on a TV screen, the click comes days later from a phone, last-click reporting hands the sale to search, and the line item gets cut. This week, verified at the order level, that supposedly unmeasurable channel bought a new customer for $360 while carrying the second-highest new-customer share of any paid channel at 79%, behind only Meta's 91%. Video is prospecting almost by definition, and this week the prospecting got dramatically more efficient.
The honest note, and this one needs to be firm. This is one week of data on a channel carrying 4.3% of tracked spend, so a smaller pool of accounts can move the aggregate more than it could on Meta or Google. Part of the drop is plain post-holiday normalization, because YouTube's cost inflated through the holiday weeks. But the give-back defense only stretches so far: a return to normal would land YouTube back in its pre-holiday range, and $360 is far below it, with the new-customer mix shift pointing the same direction. I am calling this a watch-list item, not a scale signal. If nCAC holds under roughly $450 next week with the new share staying near 80%, it starts to look structural. One week is never a budget decision.
03 / New Customer Acquisition
The full acquisition picture, by channel
Beyond the YouTube row, note the search recovery I promised to report: Google and Microsoft conversion both climbed as the holiday effect unwound, exactly the snap-back Issue 011 predicted. TikTok swung violently the other way, conversion up 329% and nCAC down 80% to $227, but it whipsawed just as hard downward the week before, so I treat its week-to-week reads as noise until it strings a few together. Meta keeps grinding cheaper, a story we are now watching closely into Q4.
04 / First Click vs Last Click
Who starts the sale vs who takes the bow
The YouTube row here is the reason this week's reset went unnoticed on most dashboards. Video is under-credited on last click, so the platforms handing out credit gave a piece of YouTube's improvement to the search box that closed the journey. If your reporting runs on last click, your YouTube got cheaper this week and your dashboard told you Google did it.
05 / Overall Channel Performance
Where the money goes, and THE TRUE COST OF A NEW CUSTOMER
Look at YouTube's markup column against the search channels. A week ago video carried a 79% penalty between blended CAC and true new customer cost. This week it is 25%, tighter than Google's 58% and Microsoft's 70%. Search still posts the pretty ROAS numbers, and search is still where blended CAC most flatters the real cost of growth. The standing lesson of this grid does not change: the channels that look most efficient on ROAS are the ones borrowing most heavily from demand that already existed.
06 / New Customer Lifetime Value
What a new customer becomes over a year
This grid is what turns YouTube's cheap week into a real economics question. A YouTube customer starts at $79 and nearly triples inside 30 days to $233, the steepest early payback curve of any paid channel, reaching $261 at one year. Judged on day-zero math, a $360 nCAC against a $79 first order looks indefensible. Judged on the 30-day number, the gap nearly closes on click-credited revenue alone, before any view-through contribution. The standing caveat applies: this grid blends brands at very different price points, so it is a directional market benchmark, not a promise for any one store.
07 / Conclusion
Put video on the watch list, with a number attached
The September story so far: the holiday came and went, search snapped back, Meta keeps getting quietly cheaper, and now video just posted the biggest verified efficiency move of the month while most dashboards handed the credit to the search box. None of that is visible on last click, and none of it is visible on ROAS.
The move this week is specific. Pull your own YouTube new customer cost, verified against orders, not platform-reported. Write down this week's number and the new-customer share next to it. If both hold through next week, you have an early position on a channel most of your competitors stopped measuring years ago. That is the entire advantage: not spending more, just knowing sooner. I will publish what the aggregate did either way.
See your own version of these four grids.
Your real nCAC next to your aCAC, your first versus last click gap, your new customer LTV by channel, in your own account.
Get the Paid Traffic Truth Report directly to your inbox.
How this week's numbers were built. Aggregated across hundreds of Wicked Reports client accounts for the week of September 13 to September 19, 2026, except first click vs last click, which uses a rolling 90 day window. New versus repeat is verified at the order level against first party order IDs, not modeled and not surveyed. The new visit to new customer conversion rate credits the channel that originated the new visit. Channels without cost data, including email, SMS, organic, and influencer, are left out of the cost comparisons. Snapchat is excluded for negligible spend. Pinterest is marked with an asterisk because it ran on a small number of new customers this week, so it is not used to anchor any headline. The channel labeled Facebook in the underlying platform data is shown here as Meta. Charts and tables carry meaning through direction, labels, and contrast rather than color alone.