What is a Good eCommerce CAC? Benchmarks to Optimize Ad Spend & ROI
Customer Acquisition Cost (CAC) is a critical metric for anyone using paid advertising for an ecommerce brand. If your CAC is too high, revenue won't grow, but if you aren't spending enough on leads they will not convert to customers.
Using CAC, you can determine whether a particular paid advertising channel or campaign is profitable. This keeps you from wasting ad spend on losing campaigns, and helps to scale campaigns that bring in actual paying customers.
how to calculate Ecommerce CAC
Customer Acquisition Cost is calculated by dividing total ad spend by the number of new customers acquired. This can be done for any time frame (daily, monthly, yearly, ect) and for any advertising channel, ad campaign, or ad.

One of the problems with calculating CAC using Google or Facebook Ad Manager is that these platforms do not differentiate between new customers and repeat customers. A sale is a sale to them, so adding up purchases might give you something to compare against, but there's no way to calculate an accurate CAC using Ad Manager data.
Our Wicked Reports multi-touch marketing attribution Dashboard is able to track each customer individually. Every interaction a customer has with your brand, from first click to last click is documented in our Customer LTV report.
In this example report, you can see which coupon offer and audience brought a customer to click and opt-in for the first time.
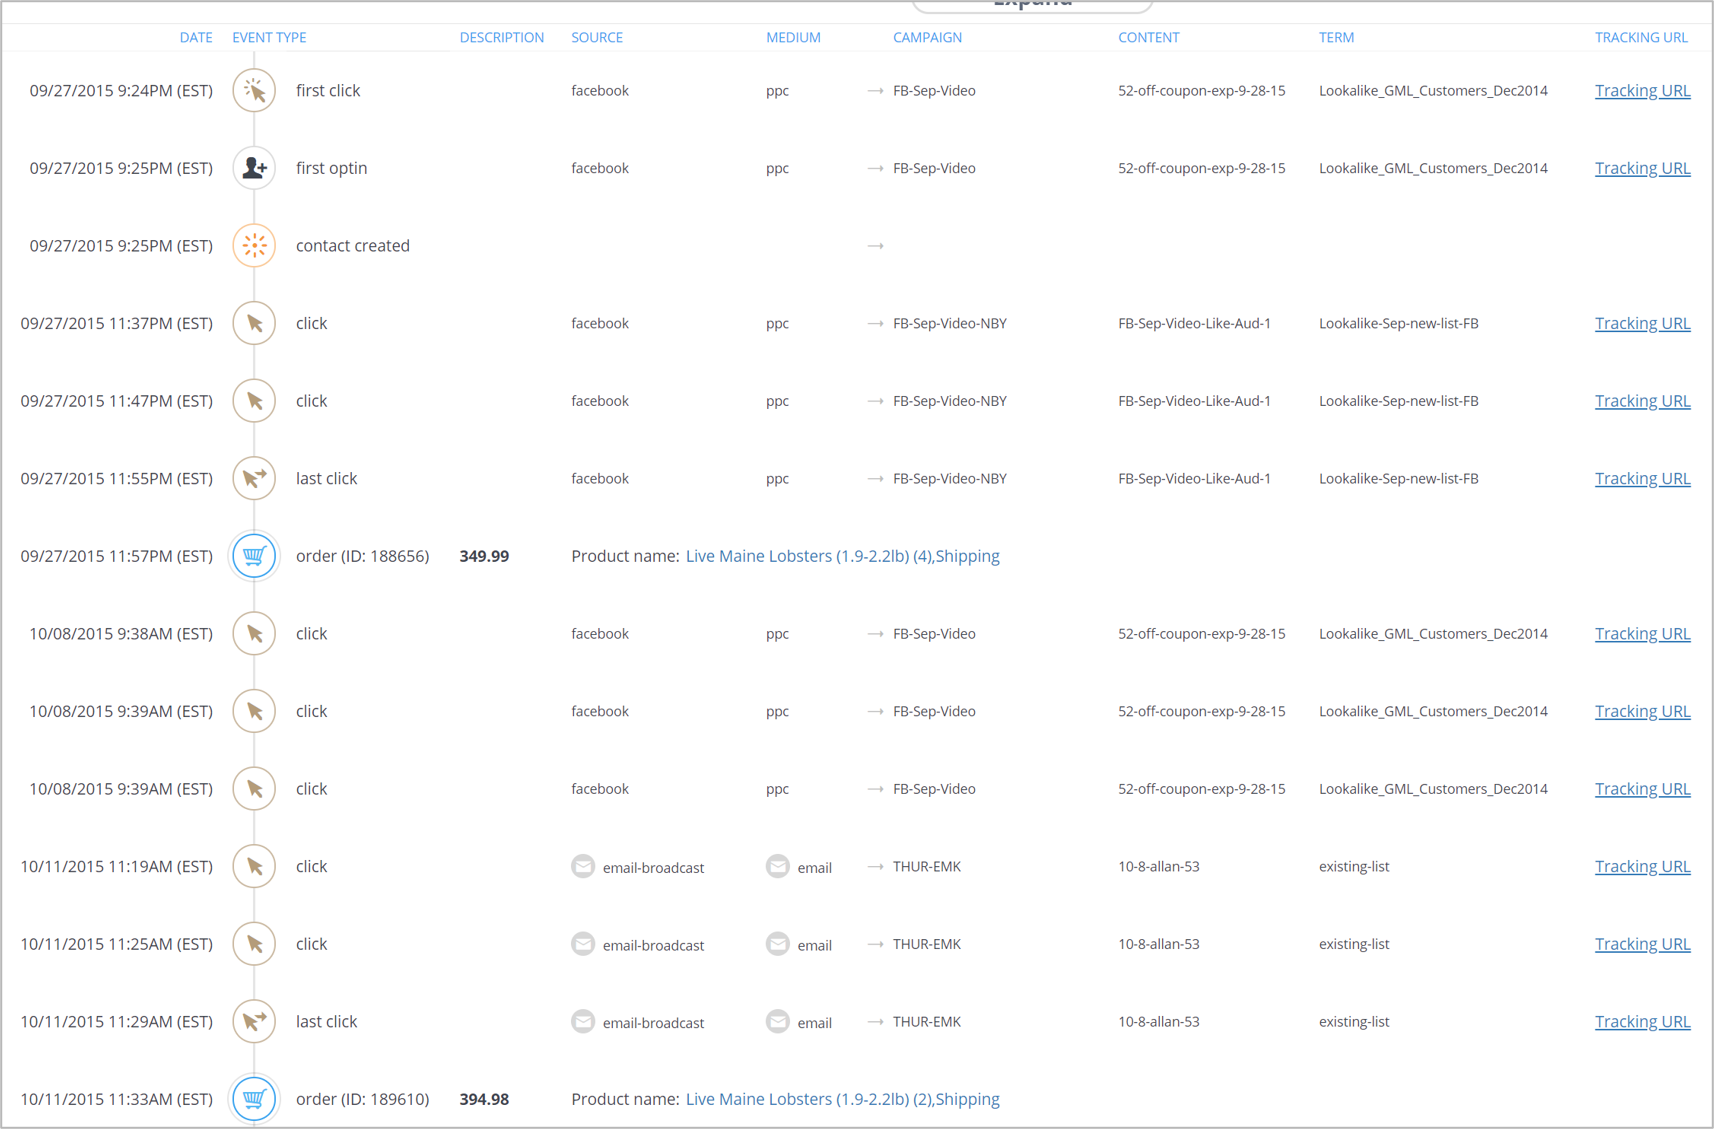
You can also see which ad campaigns enticed this customer to purchase twice. There is also information in the report (not shown) that tracks their lifetime value (LTV).
Because Wicked Reports tracks this information individually for each customer, we are able to identify the number of new customers for each ad channel, campaign or ad and accurately calculate LTV.
What is a good CAC?
 CAC is going to vary wildly for ecommerce companies depending on product offerings and Average Order Value (AOV).
You definitely want your CAC to be profitable, so it's a good idea to take a look at ROI as well as CAC. If CAC is really low but AOV is also low and the cost of goods (COGS) plus operational costs is high, CAC won't matter because the ads aren't profitable.
For example, let's say your CAC is $50. If AOV is $130, then you're seeing $80 for each order after ad spend.
But wait a minute, because to find out if the paid ads are profitable, we also need to consider all the other costs associated with your product.
- COGS for the average order is $35.
- Ad Agency Fees are $5,000/month and you get about 500 orders monthly. Ad agency fees are about $10 for each purchase.
- Operational costs (employee salaries, overhead, warehousing costs, credit card fees, ect) for the business average to about $10 per order.
***For illustration purposes only***
Adding all these costs together looks like this:
CAC + COGS + Agency Fees + Operational Costs = $50 + $35 + $10 + $5 = $100
That only leaves about $30 in profit for every sale you make. It's easy to see how a higher CAC can affect an ecommerce brand deeply.
Why Customer LTV is a Better Metric Than CAC for Ecommerce Brands
Customer Lifetime Value (LTV) tracks customer value, rather than just new customers. To grow a brand, it's important to not just bring in new customers, but also high value customers. High value, repeat customers who love your products and buy over and over again will reduce ad spend because their orders usually don't cost as much as new customer orders.
Insight into high value customers and their journey from finding your brand to making their first purchase can help target cold traffic with a higher likelihood of bringing in new high value customers.
That's we created the New Customer Cohort Report for our clients. This report helps make it easy to identify which campaigns or channels are bringing in higher value customers. Once you have this information, recreating the customer journey for high LTV customers becomes simple and lucrative.
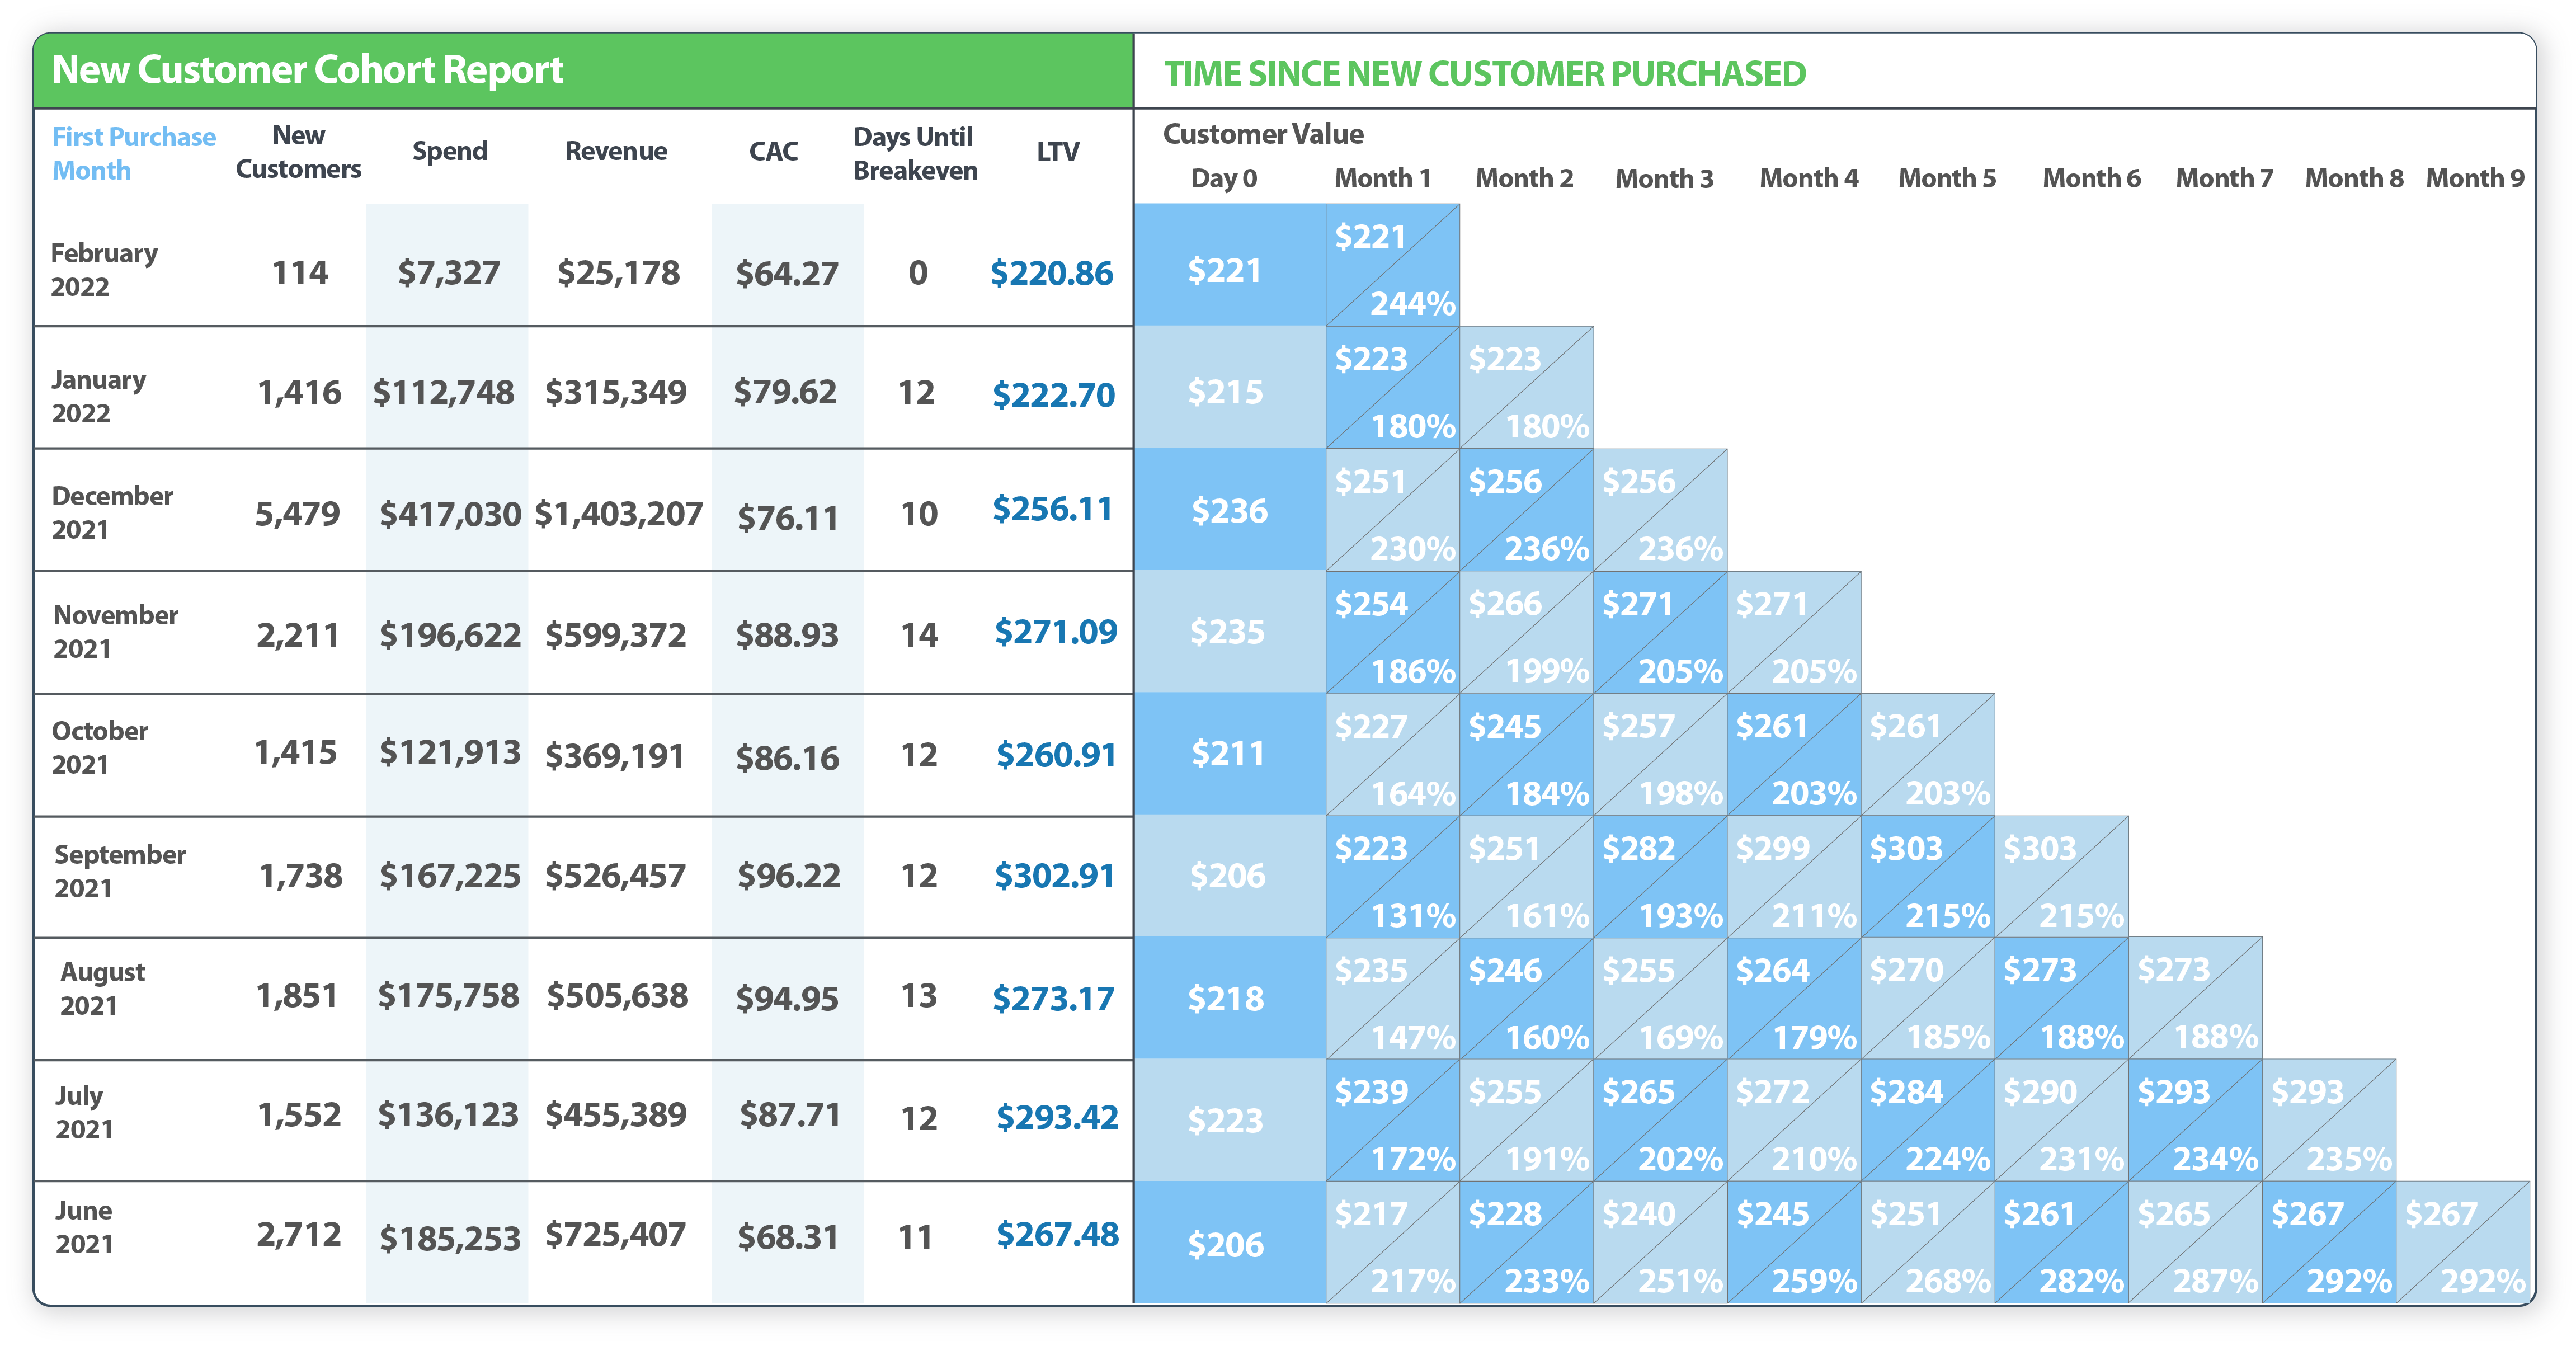
This is an actual Wicked Report ecommerce client's New Customer Cohort Report. Take a look at July 2021. The 1,552 customers acquired during that month spent an average of $223 on their first purchase. That is $346,000 in revenue just for that month!
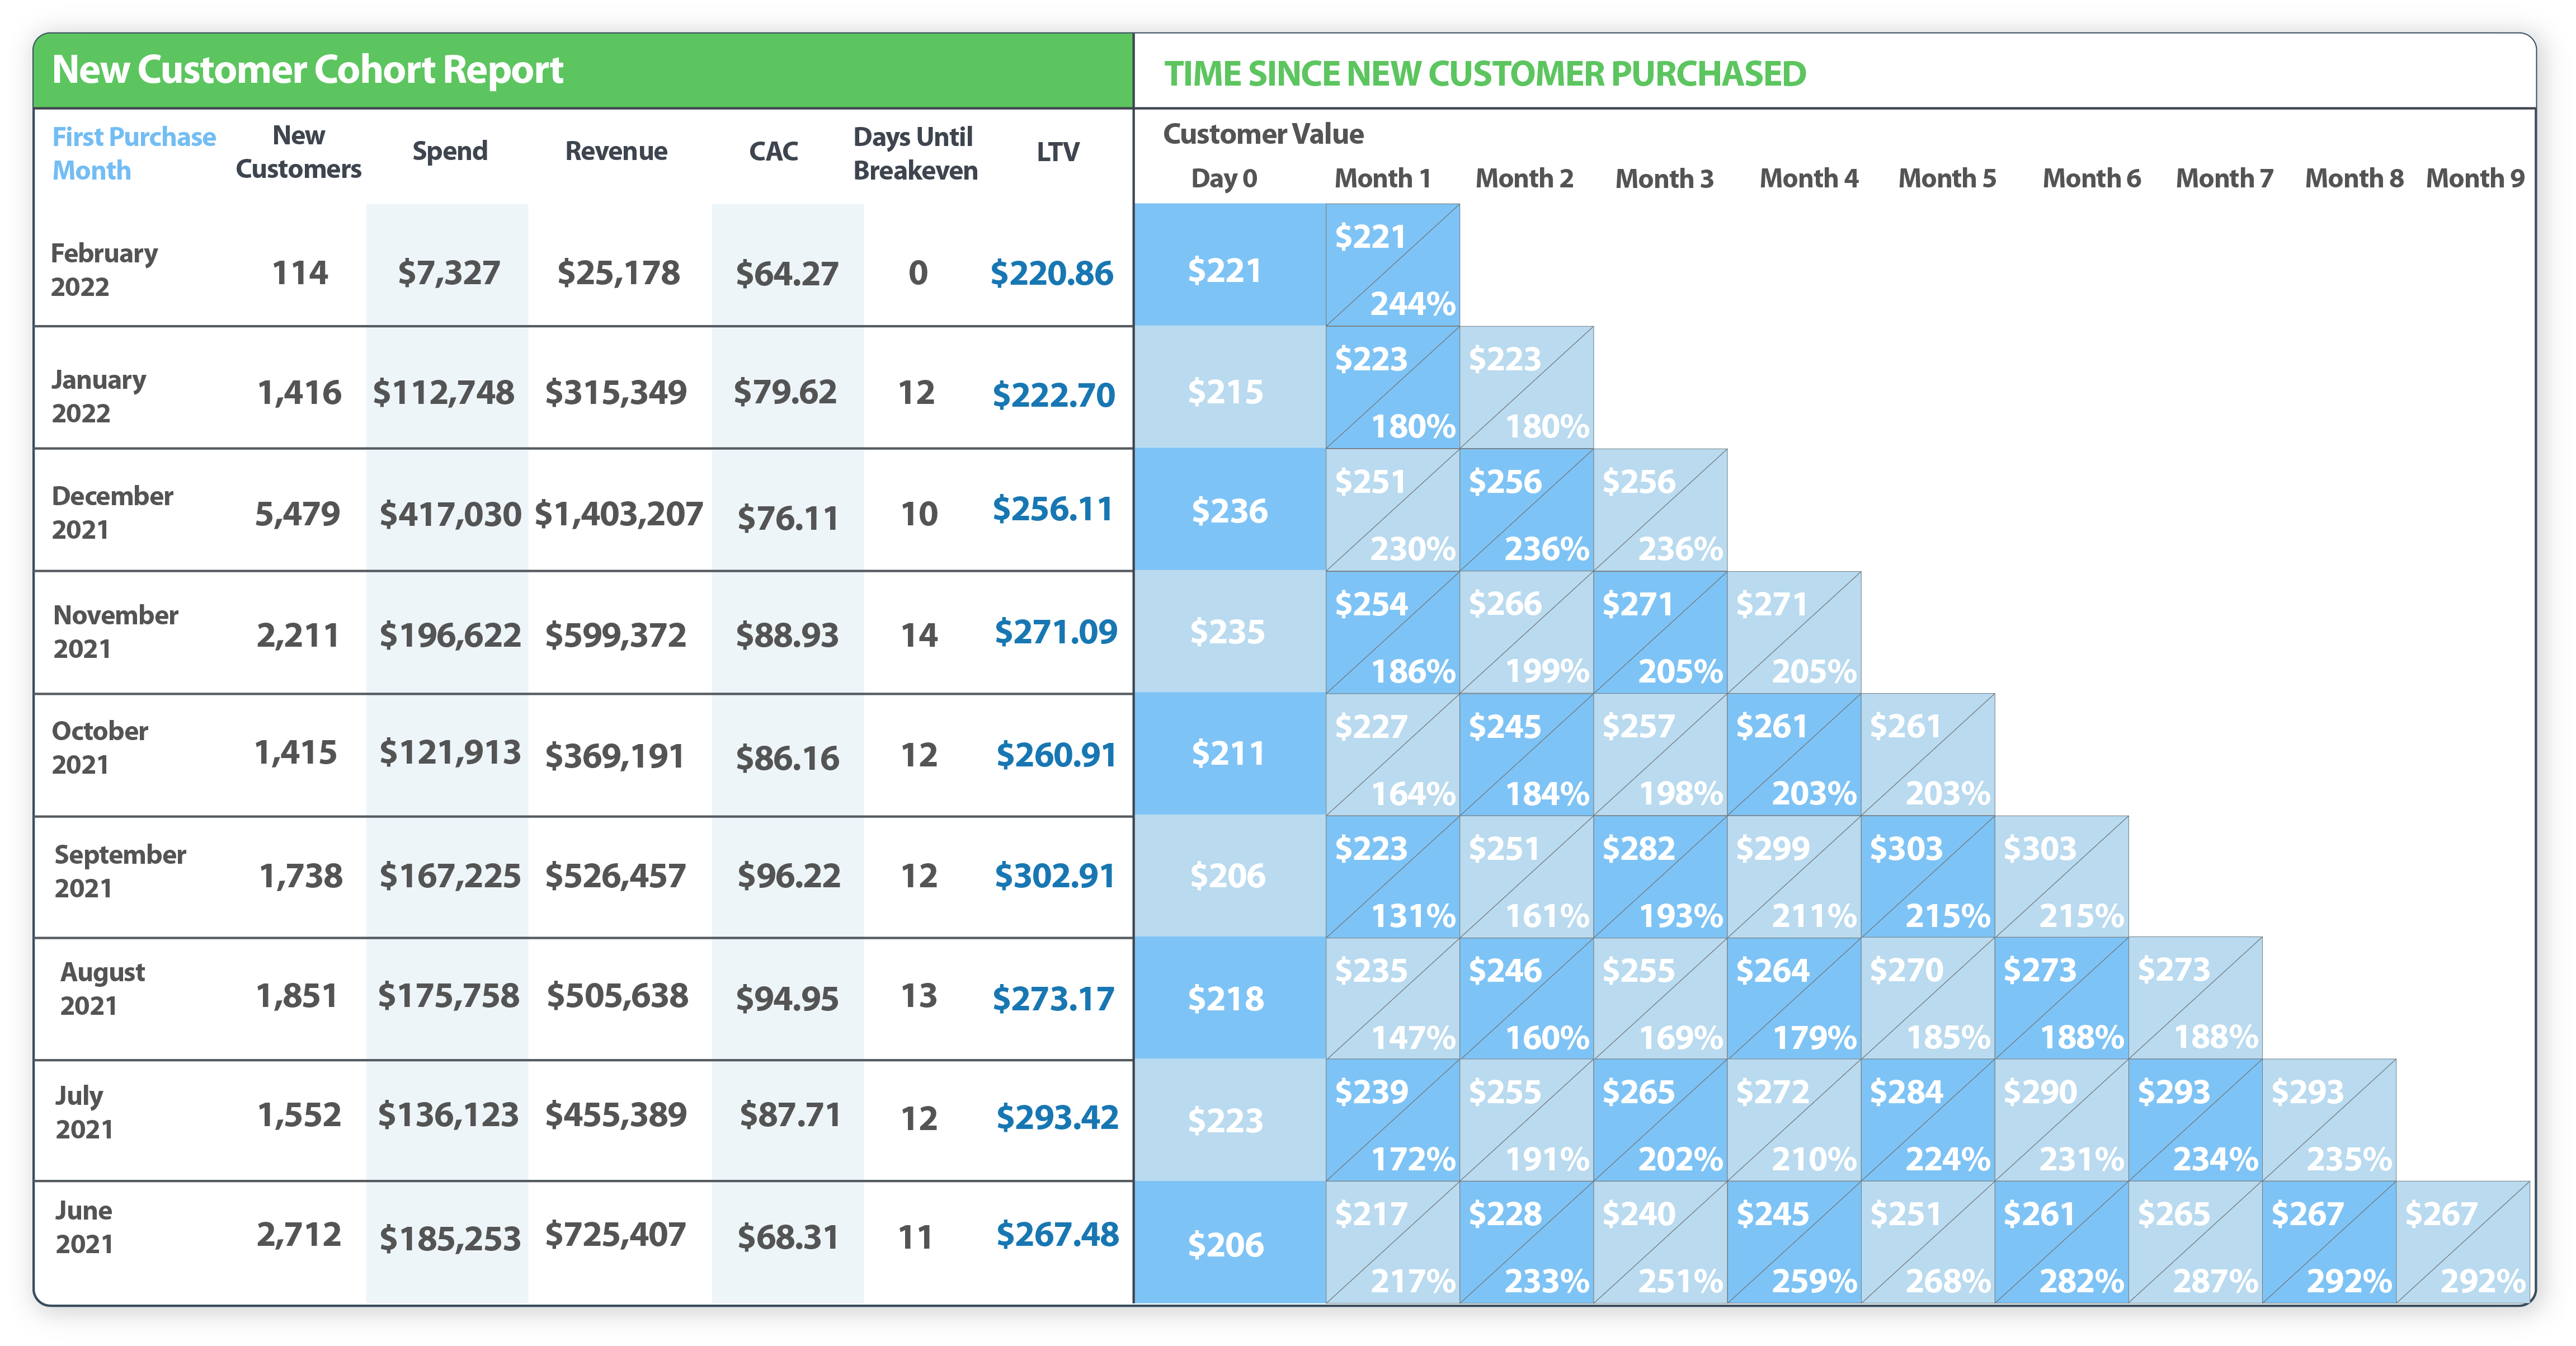
By month 7, those new customers acquired in July had spent a total of $293 on average. This means that each customer spent about $70 more on our client's products in those 7 months. That is another $108,000 from this cohort of new customers.
Compare that with December's cohort. This group of new customers spent $236 on their first order, which is $13 more than July's cohort. It's only been three months since they first bought, but during that time their LTV has risen to $256. They spent about $20 more on average. July's cohort went from $223 LTV to $265 during the first three months, which is $42 in additional purchases on average.
This is a lot of numbers... and you're probably wondering what value this information has.
What if you could look at the paid ads you used in December to get a higher first order value, and combined that with the MOF content you used to convert more repeat customers from July's cohort?
Here's where we started:
July Cohort
Number of New Customers: 1,552
Day 0: LTV = $223; Total Value = $346,096
Month 3: LTV = $265, Total Value = $411,280
December 2021 Cohort
Number of New Customers: 5,497
Day 0: LTV = $236, Total Value = $1,297,292
Month 3: LTV = $256, Total Value = $1,407,232
For comparison purposes, let's use the same number (5,497) of new customers during the 2022 December shopping season. We use the content with a higher initial purchase value from December 2021 so each customer spends $236 on Day 0. Then, we use the better MOF content from July 2021 to get more repeat orders and bring up customer LTV in month 5 to $265.
New December 2022 Cohort
Number of New Customers: 5,497
Day 0: LTV = $236, Total Value = $1,297,292
Month 3: LTV = $265, Total Value = $1,456,705
That extra $9 in LTV from the improved MOF content brings in an extra $50,000 in revenue.
All we had to do was eliminate content that didn't perform and use the better converting content from the July Cohort!
![]() How do you find the winning content? Discover what converted using our Customer LTV report or ROI Reporting!
How do you find the winning content? Discover what converted using our Customer LTV report or ROI Reporting!
Using these tools, you can deep dive into what ad channel or campaigns were winners and then recreate that customer journey.
How To Improve CAC for An Ecommerce Company
Improving ecommerce Customer Acquisition Cost by focusing on high value customers, even for cold traffic, is easy with the right information.
Here are some tips on what to look for:
- Use accurate marketing attribution data (don't rely on Ad Manager to identify new customers, it can't!).
- Focus on LTV and not CAC.
- Deep dive into paid advertising content at each step of your funnel and use what works, ditch what doesn't.
Now that you know Ad Manager can't help you get an accurate CAC number, it's time to check out Wicked Reports. Using our accurate, multi-channel marketing attribution dashboard and reporting will give you a huge advantage over your competition that is still relying on stone age reporting in Ad Manager.
FAQ
Why are Google and Facebook Ad Managers inaccurate for calculating CAC?
Ad Manager platforms do not differentiate between new customers and repeat customers. They count every sale, regardless of customer status, which can make your new customer CAC look artificially lower and is inaccurate for gauging the true cost of acquiring a brand-new buyer.
What is the key advantage of using LTV over CAC for an ecommerce brand?
Customer Lifetime Value (LTV) tracks the total value a customer brings over their entire relationship with your brand. Focusing on LTV encourages you to target and acquire high-value, repeat customers, which ultimately reduces long-term ad spend and increases total profitability.
How does Wicked Reports help improve my ecommerce CAC?
Wicked Reports provides accurate, multi-touch marketing attribution to identify the true number of new customers from each campaign. By connecting this data to their subsequent LTV, you can confidently shift your ad spend toward campaigns that acquire the most profitable, high-value customers.


