What is a Good ROAS? Benchmarks for Ecommerce Advertising ROI
Getting a good Return On Ad Spend (ROAS) makes the difference between a thriving ecommerce brand and a dying one. It’s important to understand how to use ROAS as a metric to make marketing decisions about your paid advertising, and also when ROAS might not be that helpful.
ROAS is especially important for ecommerce businesses who are running multiple ads on different channels. It gives a metric that can be tracked at the channel, campaign, or ad level to determine what is working and what is not with regards to advertising performance.
Using ROAS, you can often tell at a glance whether an ad is a candidate for scaling or needs to be turned off. It’s very helpful for evaluating the effectiveness of specific advertising campaigns, rather than a 10,000 ft view of your marketing department.
Keep reading to find out how to calculate ROAS, the difference between ROAS and ROI, how to know if a campaign’s ROAS is good or bad, and some common misconceptions about this critical metric.
What is Return On Ad Spend?
Return On Ad Spend, also known by the acronym ROAS, is an important KPI for digital advertising agencies and ecommerce brands.
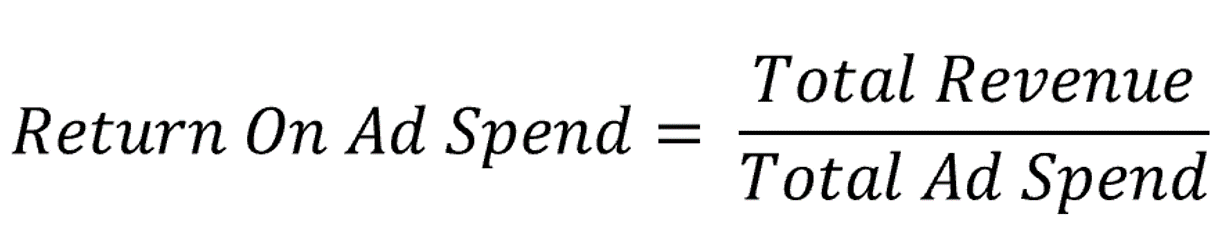
ROAS is calculated by dividing the total revenue from a specific ad campaign or channel by the total amount spent on that ad campaign or channel. This gives you an idea of how much bang for your buck you are getting for your advertising budget.

A positive ROAS means that a campaign is making more money than it is spending. A negative ROAS means a campaign is losing more money than it is gaining in revenue.
A negative ROAS on a new campaign isn’t necessarily cause for alarm or to immediately turn off that campaign or channel. I’ll explain why in a few minutes.
ROAS vs ROI
You’re not alone if you are unsure about the difference between ROI and ROAS.
The biggest difference between them is that ROAS looks only at revenue, and ROI is related to actual profit after taking into account all expenses.
Return On Ad Spend (ROAS) includes only your costs directly from ad spend. It’s ideal for making marketing decisions for a specific channel, campaign, or ad, because you can pinpoint performance at each level.
You are probably wondering what the difference is between ROAS and ROI. ROI is best used for looking at your overall marketing effectiveness, and ROAS is best for looking at specific advertising channels or campaigns.
Another easy to stop difference is that ROAS is a multiplier number (like 5.25) and ROI is going to come out at a percentage. This is because the formulas for calculation are quite different.
If you are calculating ROI instead of ROAS, then you need to add your other related expenses in addition to your ad spend.
These might include:
- Agency fees.
- Content creation costs.
- Operational costs like software, employees, taxes, and fees.
ROI is calculated by taking all the profits, minus the costs (net profit) divided by the total cost. Multiply by 100% and you will have calculated ROI.

How to calculate ROAS FROM FACEBOOK AD MANAGER
To calculate ROAS, add up all the revenue that can be attributed to overall advertising, channel, or campaign (depending on which you are calculating for).
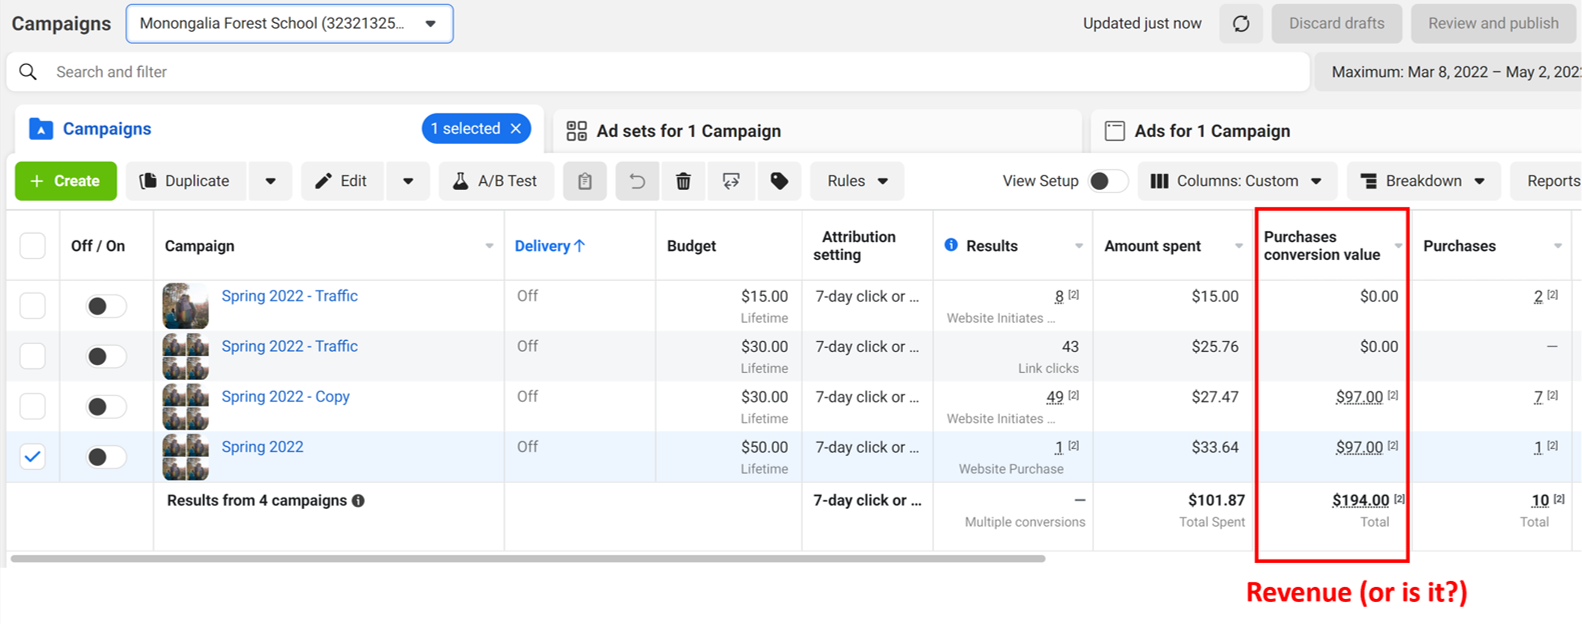
A word of warning, Facebook's reporting may not always be accurate.
In this example, Facebook is attributing $194.00 to conversion value for all 10 sales. But, this product value is $97. $97 x 10 = $970. There are a lot of reasons why this might happen, from a bad analytics set up, issues with your reporting offline sales back to Facebook properly, or incorrect values set in purchase value.
It's a good example of why you always want to check your actual revenue from payment processor against Ad Manager.
Actual revenue will almost never match Facebook reported revenue, and there is no way to know which sales are missing or being overcounted - unless you are using Wicked Reports.
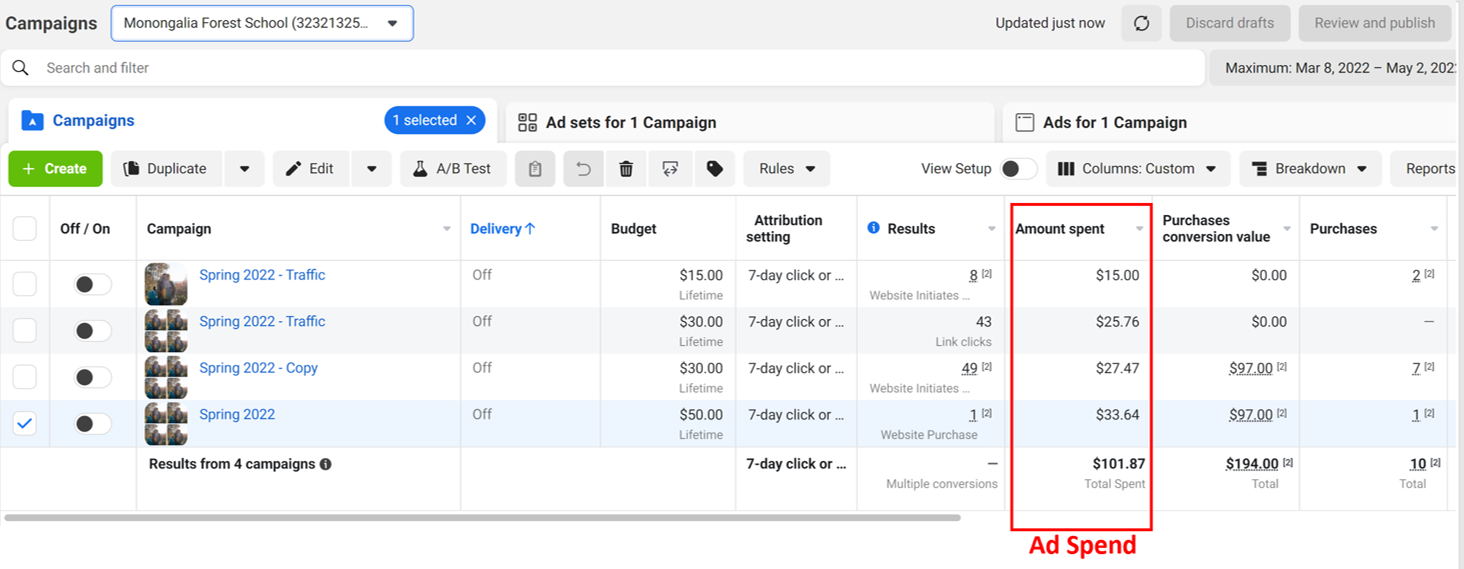
Next, you will want look at total ad spend. Unsurprisingly, this one is pretty much always accurate.
Divide the revenue by the ad spend, and voila! You get your ROAS. In this example, we will calculate using actual revenue and not Facebook's underreported revenue (by 5X!).
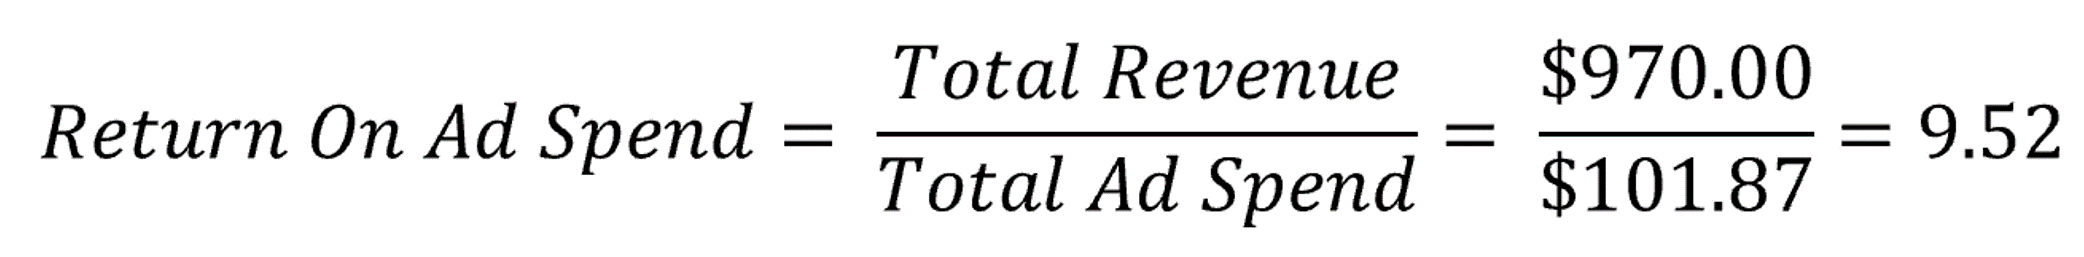
If you relied on Facebook alone, you might think your ROAS was only 1.90 for this account and time period. Big difference from 9.52, right?
This is why accurate multi-channel marketing attribution is so critical to optimizing your ROAS.
What is a good ROAS?
Data shows that a general 'good' ROAS for eCommerce in 2025 is around 3:1 to 4:1 (meaning you generate $3 to $4 in revenue for every $1 spent). However, this number is volatile due to rising ad costs, privacy changes, and shifting platform dynamics. The true profitability metric is the **Net Profit On Ad Spend (NPOAS)**, which factors in your margins and LTV. A good ROAS on Meta/Facebook is often lower ($\sim2:1$ to $3:1$) than on high-intent platforms like Google Search ($\sim5:1$ to $8:1$). This is why single-platform ROAS targets are misleading.
You might think that when you see a campaign with negative ROI, you should turn it off immediately. But hold up and take a minute to evaluate before you do, because even a negative ROAS campaign might pay off big.
Expert advertisers know that leads take time to buy. This means that you need to give campaigns time to convert before pulling the plug.
If you have no patience and turn campaigns off before really seeing results, you’ve wasted the ad spend you already put in and you’ll have no idea if you just turned off a truly winning campaign.
Some common advice for Facebook advertisers is to wait just 3 days before turning off a campaign, because this is how long it can take for Facebook to process and correctly attribute data.
This is bad advice. Don’t follow it.
So how long should you run a campaign at negative or 0 ROAS before turning it off?
The answer is at least one buying cycle for your product. A buying cycle is the average time it takes for cold traffic to make a purchase. Some brands base this on first-click, others on new leads to purchase. You can use either, depending on which of those your brand tends to focus on as an objective in your paid ad campaigns.
How to improve your ROAS
The best way to improve your ROAS is to shift your focus from single-purchase ROAS to the LTV:CAC ratio. You should be willing to accept a lower initial ROAS on cold traffic if you know that traffic segment has a significantly higher LTV.
At Wicked Reports, we help our clients do this by making it easy to identify high lifetime value (LTV) customers by connecting ad clicks to backend sales and CRM data. This allows you to:
Replicate Winning Audiences: Go back and view every click in the high-LTV customer's journey to find the campaigns that initiated the most profitable relationships.
Outbid Competitors: Confidently outbid competitors on cold traffic knowing you can afford a higher Customer Acquisition Cost (CAC) because you have the highest LTV.
Using our customer LTV report, you can see each click when it happened. This allows our clients to break down what advertising channels and campaigns are actually converting, and to cut out the fluff. It also helps make it easy to see what type of content and creative attracts your highest LTV clients.
This is powerful stuff for recreating that journey over and over again and finding new customers from affordable cold traffic.
Interested in how to use Wicked Reports to improve your ROAS and solve your attribution problems?
![]()
FAQ
What is the key difference between ROAS and ROI?
ROAS (Return On Ad Spend) measures the revenue generated for every dollar spent on advertising only. ROI (Return On Investment) is a measure of your actual profit after taking into account all business expenses, including product costs, operational fees, and ad spend. ROAS is great for optimizing specific ads; ROI is the best metric for overall business health.
What is considered a good ROAS for an eCommerce brand in 2025?
A general rule of thumb is that an eCommerce brand should aim for a ROAS of 3:1 to 4:1 (generating $3-$4 in revenue for every $1 spent). However, your real target depends on your profit margins and your product's Customer Lifetime Value (LTV). A high-LTV, subscription-based business can be highly profitable with an initial ROAS of 2:1, while a low-margin dropshipping business might need 5:1 just to break even.
Why are multi-channel attribution tools like Wicked Reports critical for accurate ROAS?
Ad platforms (Meta, Google, etc.) are limited by their own tracking and often rely on last-click data, which significantly under-reports the value of upper-funnel and mid-funnel campaigns. Wicked Reports solves this by connecting ad clicks to your CRM/sales data, providing a full-funnel, multi-touch view. This prevents you from making the costly mistake of pausing campaigns that are secretly driving high-LTV customers.