.png)
FUNNELVISION : SEE WHICH FUNNEL STAGES ACTUALLY DRIVE SALES AND CUT WASTED AD SPEND
Most ecommerce brands can tell you their overall ROAS. Far fewer can tell you which stage of their funnel is quietly burning money. That gap is where ad budget goes to die. FunnelVision is the Wicked Reports report built to close it by showing you the full customer journey stage by stage so you can see exactly where spend is working and where it is wasted. Here is what it does and why it matters.
THE PROBLEM FUNNELVISION SOLVES
A blended ROAS number hides more than it reveals. It averages together your top of funnel awareness spend your middle of funnel nurture and your bottom of funnel closing so a healthy overall figure can mask a top of funnel that is bleeding money or a middle of funnel that is doing nothing. You cannot fix what you cannot see and a single blended number keeps the funnel invisible.
The ad platforms make this worse, not better. Each one sees only its own slice and defaults to claiming the conversions closest to the sale so your true top of funnel demand creation goes uncredited while retargeting and branded search look like your only winners. Optimize on that and you cut the very campaigns that fill your funnel.
WHAT FUNNELVISION SHOWS YOU
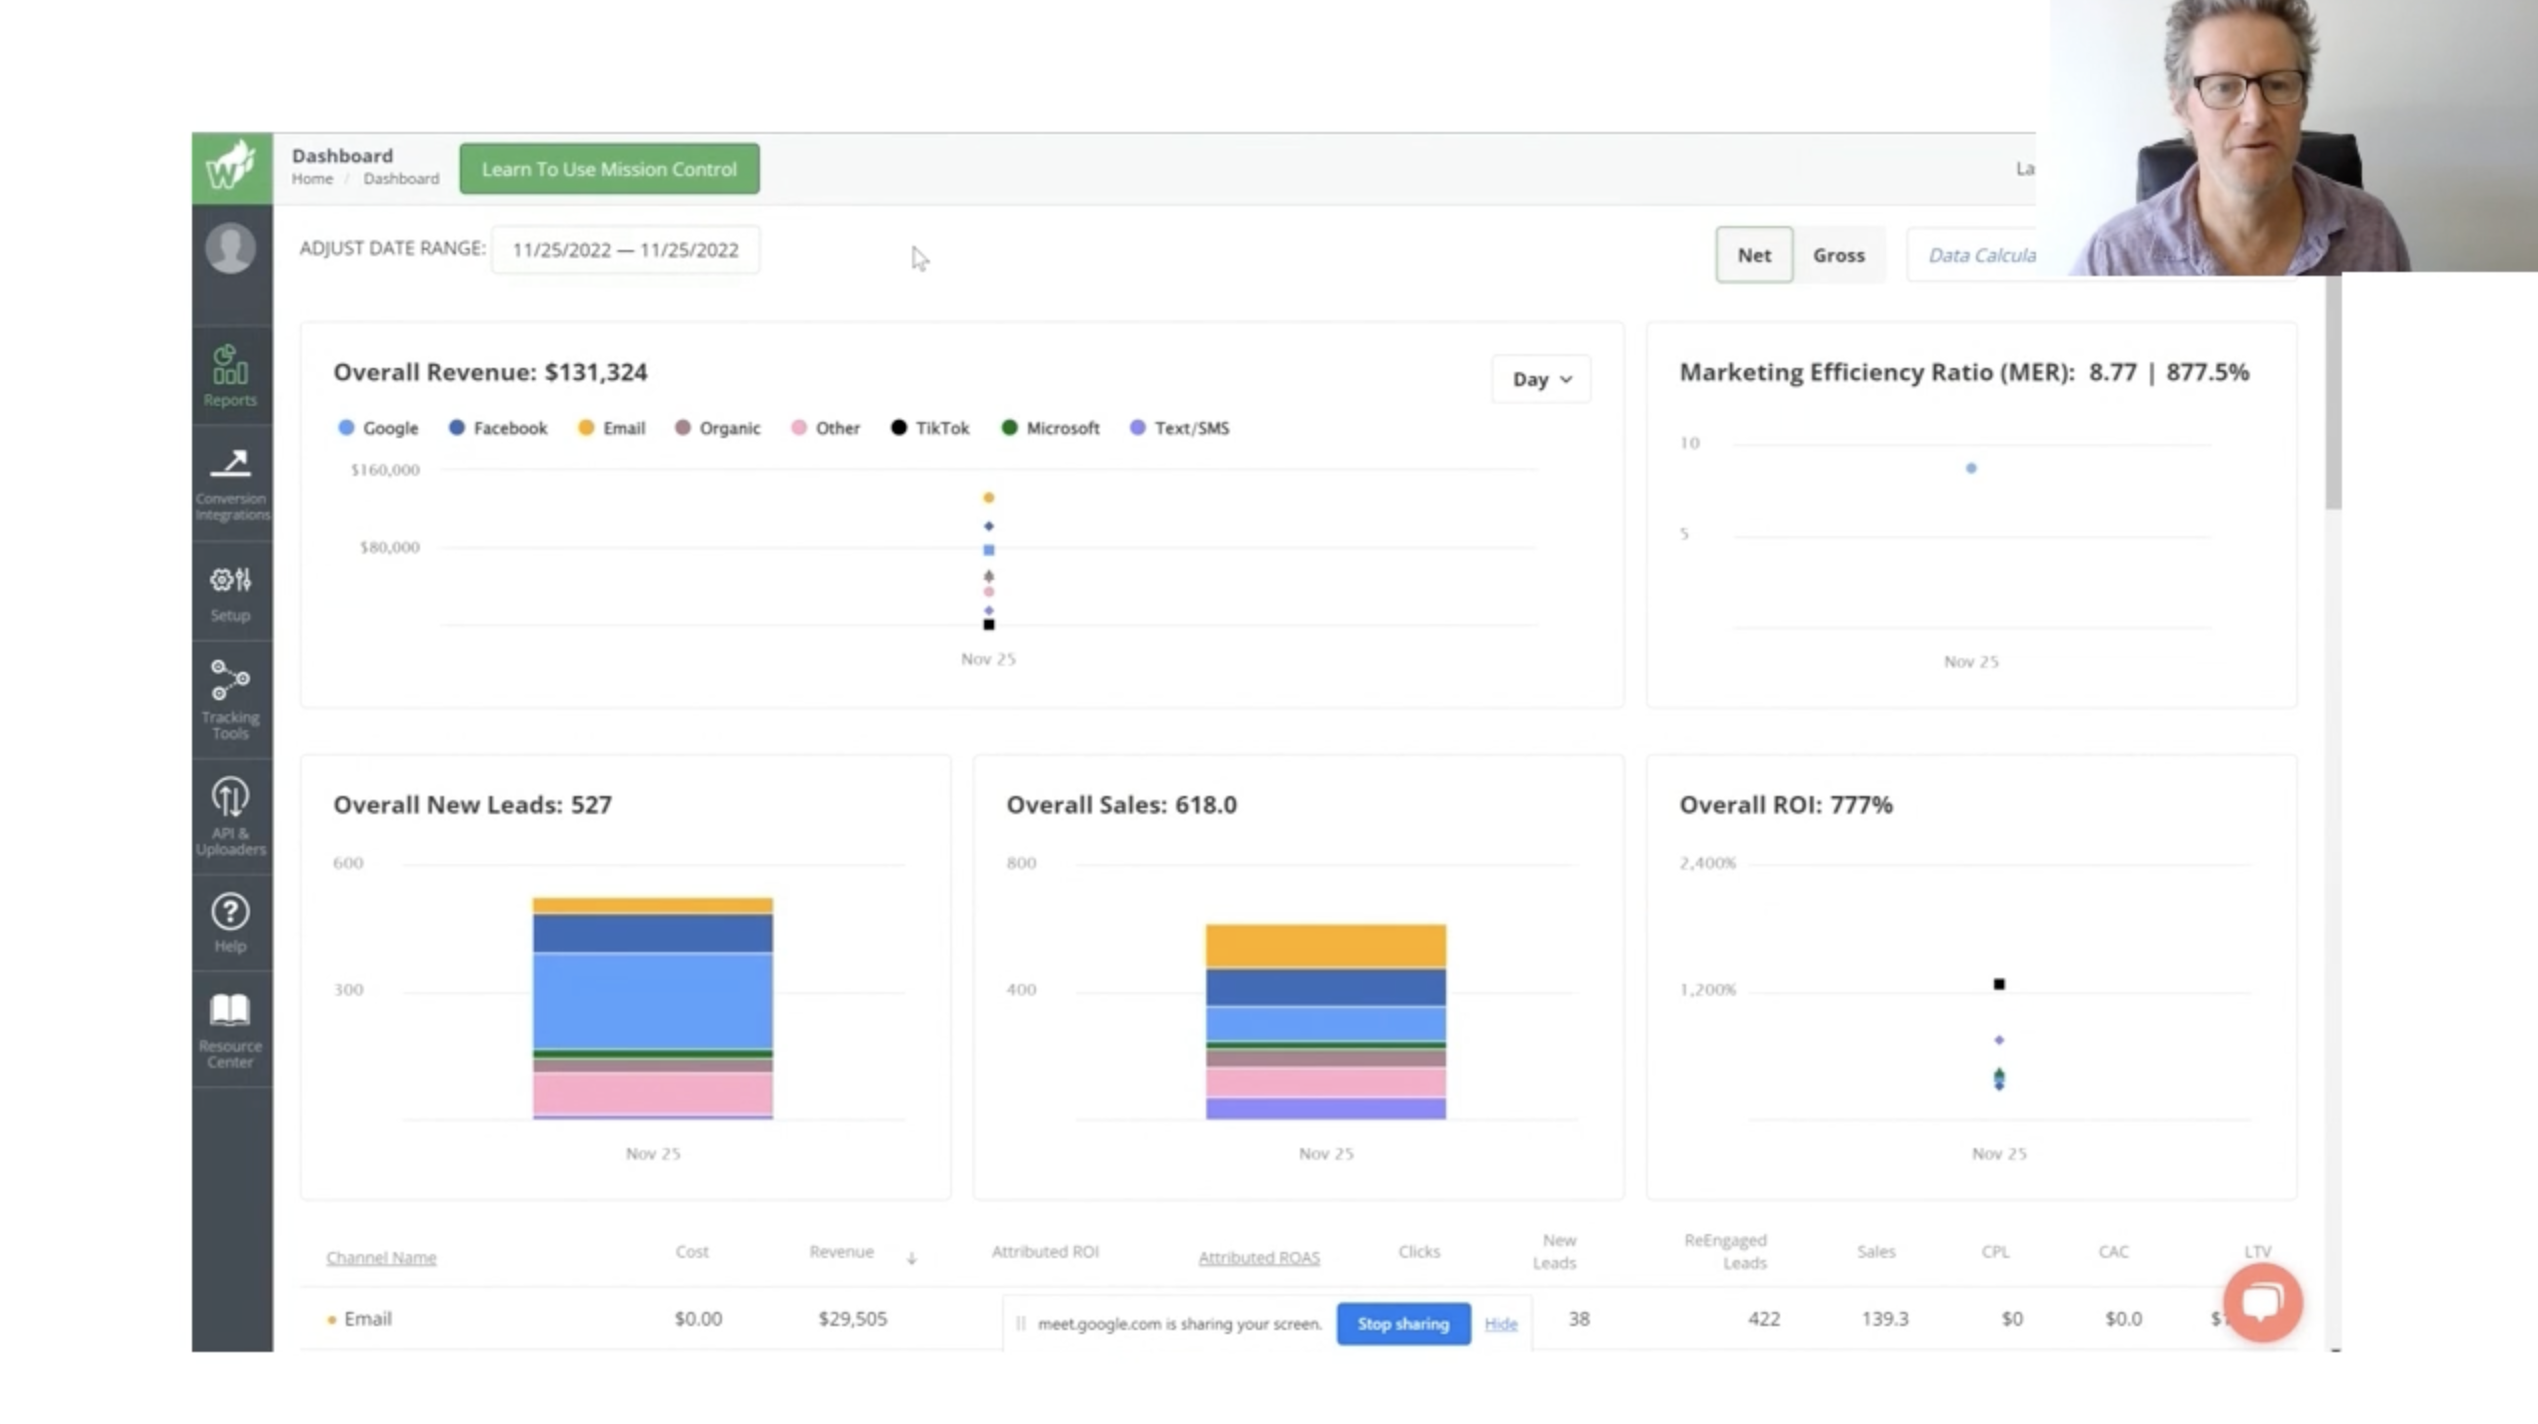
FunnelVision gives you a visual full-funnel view of how customers actually move from first touch to purchase and how much revenue each stage truly drives. Instead of one averaged number, you see the funnel broken into its real stages so you can spot which stage is strong, which is weak and where budget is being wasted.
That lets you do what a blended number never can. Identify the stage that is leaking spend and fix it. See which top of funnel campaigns genuinely create customers who buy later rather than which ones merely look busy. Reallocate budget from stages that harvest existing demand to stages that create new demand. Judge each stage on the revenue it actually produces across the full journey, not on what a single platform claims.
Premium jewelry brand Link Necklaces used FunnelVision together with new-customer attribution to cut their Meta nCAC 22% and grow new customers 94% in a single Q4. You can read the full Link Necklaces story in our case studies.
WHY THIS CUTS WASTED AD SPEND
When you can see the funnel stage by stage, the waste becomes obvious. You stop pouring money into a stage that looks fine inside a blended average but is actually underperforming and you stop cutting demand-creation campaigns that a last-click view made look weak. Agency strategist John Moran used accurate full-journey attribution to cut his clients' nCAC by 30% grow new customers by 50% and reduce wasted ad spend by 20%. That is the kind of result that comes from seeing the whole funnel clearly rather than guessing from a single number. His full story is in our case studies too.
The through-line in every one of these results is the same. A blended number lets each platform grade its own homework and hides the waste. Seeing the real funnel stage by stage, reconciled against your actual sales is what turns guesswork into decisions.
HOW FUNNELVISION FITS THE BIGGER PICTURE
FunnelVision is one view inside Wicked Reports' full measurement system. It works alongside the cohort and lifetime-value reporting that shows how customer value grows over time and the multi-touch attribution that credits every stage of the journey fairly. Together they give you one unbiased picture of what your marketing is really doing rather than several self-reported ones.
You can see the FunnelVision feature in detail on its product page. And if you want to see it running on your own funnel see how it works in the platform overview or book a demo.
FAQ
WHAT IS FUNNELVISION IN WICKED REPORTS?
FunnelVision is a Wicked Reports report that gives a visual full-funnel view of the customer journey. It shows how much revenue each stage of your funnel truly drives from first touch through to purchase so you can see which stages work which waste spend and where to reallocate budget rather than relying on a single blended ROAS number.
HOW DOES FUNNELVISION HELP CUT WASTED AD SPEND?
By breaking your funnel into its real stages, it reveals which stage is leaking money and which top of funnel campaigns actually create customers who buy later. That lets you reallocate budget away from stages that merely harvest existing demand toward stages that create new demand rather than cutting the wrong campaigns based on a blended average or a last-click view.
WHY IS A BLENDED ROAS NUMBER NOT ENOUGH?
A blended ROAS averages together top, middle and bottom of funnel performance so it can hide a stage that is bleeding money or one that is doing nothing. Because ad platforms also default to crediting conversions closest to the sale, your demand-creating top of funnel goes uncredited. Seeing the funnel stage by stage reveals what the average conceals.
HOW DOES FUNNELVISION RELATE TO CUSTOMER LIFETIME VALUE?
FunnelVision shows where revenue comes from across the funnel while cohort and lifetime-value reporting show how that revenue grows over time. Used together they reveal not just which stages drive sales but which bring in the highest-value long-term customers so you can invest in the campaigns and stages that create lasting profitable growth.