

9 min read
The Paid Traffic Truth : The ROAS Trap Held a Second Week — and Got Wider
The Paid Traffic Truth — Issue 004
Published July 20,2026 * Data for the week of July 12 to July 18 2026 * Aggregated across hundreds of Wicked Reports accounts.
We said the ROAS trap was structural. A week later, the gap got wider
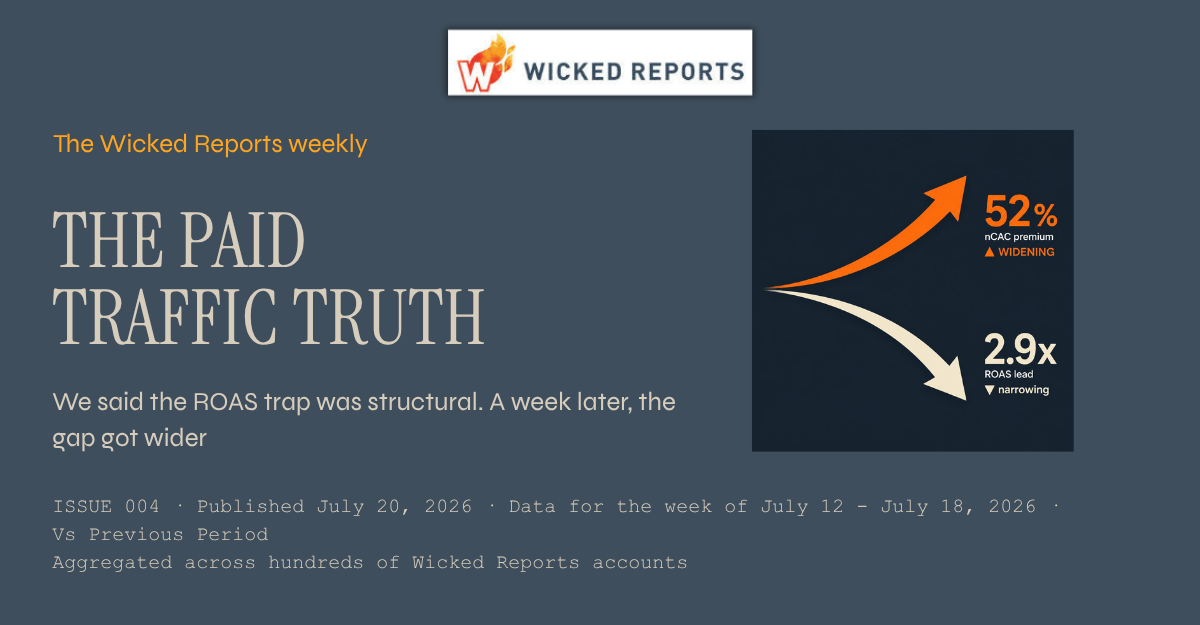
Last week I told you the ROAS trap was structural, not a July 4 hangover, and that it would look the same seven days later. It did. The only thing that changed is the gap got wider. Google's new customer went from 39% more expensive than Meta's to 52% more, while Google's ROAS lead over Meta actually shrank.
This week's number
Google's new customer cost 52% more than Meta's this week, up from 39% last week. In the same seven days, Google's ROAS lead over Meta narrowed from 3.1x to 2.9x. The two numbers are moving in opposite directions.
01 / Introduction
A follow up, because the data asked for one
Welcome to the fourth edition of the Paid Traffic Truth. Normally I bring you a new story each week. This week the data made me do something different and more useful. It let me check my own homework.
Last week's story was that ROAS ranks your channels backwards, because it fuses the cost of a new customer with the value of that customer and hides both. I said that pattern was structural, not a holiday artifact and that it would still be true after the July 4 noise cleared. This is the week that noise cleared. So let's see if it held. Every number below is first party and order verified, aggregated across hundreds of ecommerce brands.
02 / Analysis
It held. And the trap got more expensive.
Here is the honest test. If last week's ROAS trap were a July 4 mirage, this week it would soften. Search would stop looking artificially efficient, Meta would stop looking artificially weak, and the gap between reported ROAS and true new customer cost would close.
The opposite happened. Meta held the cheapest new customer in the set at $84, exactly where it was last week. Google's new customer climbed from $117 to $128. So the premium you pay for a new customer on Google, the channel that looks better on ROAS, went from 39% to 52% in one week. Microsoft, still the best ROAS in the set at 2.32, saw its new customer cost jump to $161, a 73% markup over its own blended number, up from 64%.
Sit with what that means for a budget decision. If you had watched the ROAS column last week and moved money toward Google, this week that channel's ROAS advantage got smaller and the price you paid for each new customer got bigger. You would have chased a lead that was closing while paying a premium that was rising. ROAS pointed you one way. The truth walked the other.
Here is the calendar check, because this report only works if I am honest about it. Last week you could have accused me of July 4 residue. This is the second full week clear of the holiday. The pattern did not fade, it sharpened. Two clean weeks, same direction, wider gap. That is the definition of structural. Search and Microsoft close demand and read high on ROAS. Meta prospects and reads low. It is not seasonal, and it will not fix itself.
03 / New Customer Acquisition
The full acquisition picture, by channel
Meta held its new customer cost flat at $84 and stayed the prospecting engine, with 90% of the customers it touched brand new. Google's cost rose while its new customer volume and conversion both slipped. That is the shape of the whole story in one row. The cheap acquisition channel held, the expensive one got more expensive. Pinterest ran on a tiny base again this week and carries an asterisk, so it is not anchoring anything.
04 / First Click vs Last Click
Who starts the sale vs who takes the bow
This is the engine under the trap, and it barely moved, which is the point. Last click, the model closest to what the platforms report, still inflates Google and Microsoft, the channels that close, and still shrinks Meta, the channel that opens. Meta gives back 0.14 of ROAS on last click. Microsoft gains 0.66. A rolling 90 day window does not swing on a holiday, and it did not. The credit is being handed to the closer, week in and week out.
05 / Overall Channel Performance
Where the money goes, and THE TRUE COST OF A NEW CUSTOMER
Meta and Google are again about 94% of tracked spend, so read those two rows together. Google's ROAS slipped from 1.59 to 1.43 while its new customer cost rose from $117 to $128. Both moved against you at once, and ROAS only showed you one of them. The markup column tells the same story it told last week, only louder. The gap between blended and true new customer cost is widest exactly where ROAS looks best. Microsoft's 73% markup is the cleanest example in the set.
06 / New Customer Lifetime Value
What a new customer becomes over a year
The value grid is the piece that keeps the story honest. Meta is the cheapest new customer to acquire and the lowest one year value at $97. Microsoft is the most expensive to acquire and the highest one year value at $365. This is why the answer is never simply buy Meta and cut Google. The point is that cost and value are two separate facts, and ROAS shows you neither. One caveat that always applies here. This blends hundreds of brands at different price points, so read it as a directional market benchmark, not a promise for your store.
07 / Conclusion
A pattern that survives a second week is a pattern you budget around
One week of a surprising number is a curiosity. Two clean weeks of the same number, moving further in the same direction, is a pattern. The ROAS trap is not a July 4 story and it is not going to correct itself, because it is built into how the models assign credit. The closer gets the bow. The opener gets cut.
You do not fix this with a better dashboard. You fix it with two verified numbers standing next to each other, the cost of a new customer and the value of that customer over time. Watch those instead of ROAS and the budget decision stops moving against you.
How this week's numbers were built. Aggregated across hundreds of Wicked Reports client accounts for the week of July 12 to July 18, 2026, except first click vs last click, which uses a rolling 90 day window. New versus repeat is verified at the order level against first party order IDs, not modeled and not surveyed. The new visit to new customer conversion rate credits the channel that originated the new visit. Channels without cost data, including email, SMS, organic, and influencer, are left out of the cost comparisons. Snapchat is excluded for negligible spend. Pinterest is marked with an asterisk because it ran on a small number of new customers this week, so it is not used to anchor any headline. The channel labeled Facebook in the underlying platform data is shown here as Meta. Charts and tables carry meaning through direction, labels, and contrast rather than color alone.
Topics: Wicked Reports customer lifetime value Google Ads Marketing Attribution New Customer Acquisition Cost (NCAC) Meta Ads paid traffic blended ROAS meta vs google ads paid media measurement
10 min read
The Paid Traffic Truth : Your best ROAS channel costs the most per new customer
.png)
The Paid Traffic Truth — Issue 003
Published July 13, 2026 · Data for the week of July 5 to July 11, 2026 · Aggregated across hundreds of Wicked Reports accounts
Rank your paid channels by ROAS and you get one order. Rank them by what a new customer actually costs and the order nearly flips. Google's ROAS is three times Meta's this week, and a new customer still costs 39% more on Google. If you move budget on ROAS alone, you are buying your most expensive customers on purpose.
This week's number
Google's blended ROAS is 3x Meta's. A new customer costs $117 on Google and $84 on Meta. The channel that looks most efficient is the priciest place to buy a customer.
01 / Introduction
One story, then the four grids
Welcome to the third edition of the Paid Traffic Truth. Every week I take one story from the world of paid traffic and break it down in the Analysis section, then hand you all four grids underneath it. New customer acquisition, first click vs last click, overall channel performance, and new customer lifetime value.
Every number comes from Wicked Reports first party new customer attribution and LTV, aggregated across hundreds of ecommerce brands and verified against real orders. These are the new customer numbers your ad platforms do not show you.
This week's featured story is the one that quietly reshuffles budgets every month. ROAS versus the true cost of a new customer.
02 / Analysis
ROAS ranks your channels backwards
Here is the trap. You open your dashboard, you sort by ROAS, and you make a decision. Microsoft is at 2.60. Google is at 1.59. Meta is sitting at 0.52 and looks like a problem. The obvious move is to pull from Meta and feed the winners.
Now sort the exact same channels by nCAC, the cost to acquire a brand new customer, verified against first order IDs. Meta is the cheapest in the set at $84. Google is $117. Microsoft is $141. The order you just trusted has flipped on its head.
So which sort is right. Both, and that is the point. ROAS is not lying to you. It is doing something worse. It is folding two very different numbers into one and hiding both.
Look at what ROAS is actually made of. Google closes a lot of demand that other channels created, so it books high revenue against its spend and posts a strong ROAS. Meta introduces people who have never heard of the brand, many of whom buy something small first, so it posts a low ROAS even while it is doing the hardest and most valuable job in the funnel, finding new humans.
The two numbers that ROAS smears together are cost and value. Split them apart and the fog clears. Cost is nCAC, what you pay to acquire a new customer. Value is nLTV, what that new customer becomes over the next year. This week Meta is the cheapest to acquire at $84 but the lowest one year value at $97. Microsoft is the most expensive to acquire at $141 but the highest one year value at $341. Neither of those facts survives inside a single ROAS number.
One honest note, because this report only works if the numbers are trustworthy. This is the week after the July 4 selling season, so conversion softened a little across most paid channels, the normal post holiday give back. But the story this week is not a calendar story. It is structural. Search and Microsoft close demand and read high on ROAS. Social and video prospect and read low. That pattern does not need a holiday to show up, and it will look the same next week. That is exactly why you cannot budget on ROAS alone.
03 / New Customer Acquisition
The full acquisition picture, by channel
Meta is carrying the prospecting load. It brought in more than 40,000 new customers this week, and89%of the customers it touched were brand new to the brand. That is the profile of a channel finding people, not milking a list. It is also the channel your dashboard told you to cut.
Conversion softened for most channels this week, the expected step down after the holiday selling week. YouTube was the exception, up 11%. Pinterest ran on a tiny base this week and is marked with an asterisk, so I am not using it to anchor anything.
04 / First Click vs Last Click
Who starts the sale vs who takes the bow
This grid is the mechanism behind the ROAS trap. Last click is the model closest to what the platforms report, and it inflates Google and Microsoft, the channels that close, while it shrinks Meta and Pinterest, the channels that open. Meta gives back 0.14 of ROAS on the last click. Microsoft gains 0.61. Judge a discovery channel on last click alone and you cut the thing that started the sale, then wonder why new customer growth stalled.
05 / Overall Channel Performance
Where the money goes, and THE TRUE COST OF A NEW CUSTOMER
Meta and Google are about 94% of tracked spend, so this is where the real decisions live. Put the ROAS column next to the nCAC column and read them together. Google's ROAS is roughly three times Meta's, and a new customer costs 39% more on Google. Microsoft posts the best ROAS in the set and the biggest gap between its blended and new customer cost, a 64% markup you never see if you only watch ROAS.
There is a second thing hiding in the aCAC column. On every paid channel the true new customer cost sits above the blended number, because blended quietly includes your existing customers coming back. It is widest exactly where ROAS looks best. That is not a coincidence. The channels that look most efficient are the ones leaning hardest on demand someone else created.
06 / New Customer Lifetime Value
What a new customer becomes over a year
This is the grid that finishes the story. Meta is the cheapest new customer to acquire and the lowest one year value at $97, a low order value high frequency profile. Microsoft is the most expensive to acquire and the highest one year value at $341. TikTok is expensive on day one but more than doubles its value by the one year mark, the strongest growth curve in the set.
Now the ROAS number makes sense, and it also makes clear why you should not trust it. Microsoft's strong ROAS is really a story about high value customers who close fast. Meta's weak ROAS is really a story about cheap acquisition of lower value customers who need time. Those are two completely different decisions, and ROAS gives you one blurry number for both. One caveat. This blends hundreds of brands at different price points, so read it as a directional market benchmark, not a promise for your store.
07 / Conclusion
Split the number, then decide
ROAS is not a business metric. It is an efficiency metric for a single platform, and it hides the two things you actually need to run acquisition, the cost of a new customer and the value of that customer over time. The channel that looks best on ROAS was the most expensive place to buy a customer this week. If you had moved budget on ROAS alone, you would have paid more to grow slower.
The fix is not a better dashboard. It is two verified numbers next to each other. What did a new customer cost, and what will that new customer become. Get those and the budget decision stops being a guess.
How this week's numbers were built. Aggregated across hundreds of Wicked Reports client accounts for the week of June 29 to July 5, 2026, except first click vs last click, which uses a rolling 90 day window. New versus repeat is verified at the order level against first party order IDs, not modeled and not surveyed. The new visit to new customer conversion rate credits the channel that originated the new visit. Channels without cost data, including email, SMS, organic, and influencer, are left out of the cost comparisons. Snapchat is excluded for negligible spend. Pinterest is marked with an asterisk because it ran on a small number of new customers this week, so it is not used to anchor any headline. The channel labeled Facebook in the underlying platform data is shown here as Meta. Charts and tables carry meaning through direction, labels, and contrast rather than color alone.
Topics: Wicked Reports customer lifetime value Google Ads Marketing Attribution New Customer Acquisition Cost (NCAC) Meta Ads paid traffic blended ROAS first click vs last click Paid Traffic Truth
8 min read
The Paid Traffic Truth : The New Customer Markup Your Dashboard Hides
The Paid Traffic Truth — Issue 001
The Wicked Reports Weekly · Week of Jun 21–27 2026 · Verified first-party order data · vs previous period
Across every paid channel this week, a new customer cost 20% to 60% more than your blended CAC. If your acquisition goal was built on that blended number, you are quietly starving top of funnel.
01 / INTRODUCTION
Welcome to the first edition of the Paid Traffic Truth report. Every week I feature one story from the world of paid traffic in the Analysis section, then give you all four grids underneath it - new customer acquisition, first click vs last click, overall channel performance, and new customer lifetime value. All of it comes from Wicked Reports top of funnel new customer attribution and LTV, aggregated across hundreds of client accounts and verified against real orders.
This week's featured story is nCAC vs aCAC, channel by channel.
02 /Analysis
New customers cost more than your dashboard says
This week's story is the gap between two numbers that look almost the same and are not.
nCAC = cost to acquire a new customer.
aCAC = cost to acquire any customer.
All new versus any customer data is validated against first party order IDs.
The cost to acquire a new customer this week ran $20 to $55 higher than the cost to acquire any customer. And that any customer number includes your existing customers coming back to repurchase, which is exactly why it looks cheaper than it is.
Microsoft is the sharpest example. On a blended basis a customer looks like $86. A brand new one actually costs $141, a 64% markup you never see if you only watch blended CAC. Google tells the same story at the biggest spend level in the set, $74 blended against $105 for a new customer.
Factor that markup into your nCAC goals. Start with your aCAC, spend divided by total customers. Then add at least 20% to reach a realistic new customer cost, and if you lean on search, assume a lot more. The gap this week ran from about 20% at the low end to more than 60% on Microsoft.
Now the part that quietly costs brands their growth. I see this happen constantly. Spend gets cut at top of funnel because it does not hit a CAC goal. But that goal's foundation included repeat purchasers. So you get a hamster wheel. You cut spend at TOF, you see great numbers in Meta or Google or wherever, and your bottom line new customer growth stalls.
Realistic nCAC goals are the place to start fixing that.
03 / New Customer Acquisition
nCAC vs aCAC, every paid channel
A high nCAC is only a problem if the customer never returns. New-customer value at 30, 90, 180, and 365 days tells you which expensive channels are actually your best ones.
The orange bar sits above the light bar on every single channel. The two that look cheapest on a blended basis, Google at $74 and Microsoft at $86, carry the widest jump to their true new customer cost. Cheap looking is not the same as cheap.
04 / First Click vs Last Click
Who starts the sale vs who takes the bow
Microsoft and Google post the strongest last click ROAS because they are usually the final step before a purchase. But the prospecting channels that introduce customers, Facebook, Pinterest, TikTok, YouTube, all read higher on first click than last, so a positive credit gap means last click is taking credit and a negative one means last click is giving it away. Judge a discovery channel on last click alone and you cut the thing that started the sale. More on this gap in a future edition.
Two channels own this market. Facebook is 56% of tracked spend and Google another 37%, so about nine dollars in ten flow through Meta and Google. aCAC came down on most channels this week, and Facebook's average order value fell 41%, which at this scale reads as calendar and mix rather than a change in behavior. Read the direction of the trend, not any single week in isolation.
06 / New Customer Lifetime Value
What a new customer becomes over a year
Microsoft and Google produce the most valuable new customers over a year, $324 and $215, and both clear their new customer CAC comfortably. The prospecting channels tell a growth story of their own. A new TikTok customer is worth about 2.3 times their first order value by the one year mark, Pinterest about 1.9 times. Facebook is the mirror image, cheap to acquire but the lowest one year value in the set at $111, a low AOV high frequency profile. One honest caveat. This blends hundreds of brands at different price points, so read it as a directional benchmark for the market, not a promise for your specific store.
07 / Conclusion
Measure new versus repeat, then decide
The thread through all four grids is the same. The numbers your ad platforms and your dashboard hand you, blended CAC, last click ROAS, a single week's ROAS, all flatter the channels that close and hide what a new customer truly costs and returns. Measure new versus repeat at the order level and the picture changes, sometimes enough to change where your next dollar goes.
See your own four grids
Your real nCAC next to your aCAC, your first versus last click gap, your new customer LTV by channel, in your own account.
How this week's numbers were built. Aggregated across hundreds of Wicked Reports client accounts for the week of June 21 to 27, 2026, except first click vs last click, which uses a rolling 90 day window. New versus repeat is verified at the order level against first party order IDs, not modeled and not surveyed. aCAC is spend divided by all customers. nCAC is spend divided by verified first time customers. Channels without cost data, including email, SMS, organic, and influencer, are left out of the CAC comparison and the chart. Charts and tables separate series by light and dark contrast, direct labels, and direction glyphs rather than color alone.
Topics: Google Ads Marketing Attribution New Customer Acquisition Cost (NCAC) Meta Ads eCommerce Marketing Attribution paid traffic paid media benchmarks DTC marketing TikTok ads
6 min read
Facebook Ads vs. Google Ads in 2026: Which One Actually Deserves Your Next Dollar?
-1.png)
If you're running paid on both Meta and Google — or deciding where to put your next budget increase — you've probably noticed the two platforms behave nothing alike.
Topics: Wicked Reports Facebook ads Google Ads Paid Social Media eCommerce Advertising ad platforms comparison paid search machine learning ads
5 min read
Google Ads Data-Driven Attribution Explained (2026)
-1.png)
DATA-DRIVEN ATTRIBUTION IN GOOGLE ADS : WHAT IT IS AND WHAT IT STILL CAN'T SEE (2026)
If you run Google Ads, the attribution question has been quietly decided for you. As of 2026, Google Ads offers exactly two attribution models - Data-Driven Attribution (the default) and Last Click. Everything else is gone. Here's what that means, why data-driven attribution is genuinely better than the last-click model it replaced and the hard limit that no Google model, however smart, can get past.
Topics: Wicked Reports Google Ads multi-touch attribution Data Driven Strategy marketing ROI
5 min read
GCLID vs GBRAID vs WBRAID: Google Ad Identifiers (2026)
-2.png)
GCLID vs GBRAID vs WBRAID: Decoding Google's Ad Identifiers in 2026
If you run Google Ads, you've probably noticed something odd in your landing-page URLs. Some clicks arrive with the familiar gclid parameter. Others show up with gbraid or wbraid instead. And if your tracking only captures gclid, you're silently losing attribution data on a growing share of your traffic because Google now uses three different click identifiers depending on the device, browser, and the user's privacy settings.
Here's what each one is, when Google sends it, and why capturing all three now matters more than ever.
THE SHORT VERSION
- GCLID is the original Google Click Identifier, used since 2005. It's the gold standard — a rich, deterministic identifier tied to a single click, carrying campaign, ad group, keyword, device, and more. But it only works where Apple allows it.
- GBRAID and WBRAID are the privacy-safe parameters Google introduced in 2021 for iOS traffic where gclid can no longer be used. They measure performance in aggregate, without identifying an individual user.