The Paid Traffic Truth — Issue 020
Published November 16, 2026 · Data for the week of Nov 8 - Nov 14, 2026 · Aggregated across hundreds of Wicked Reports accounts
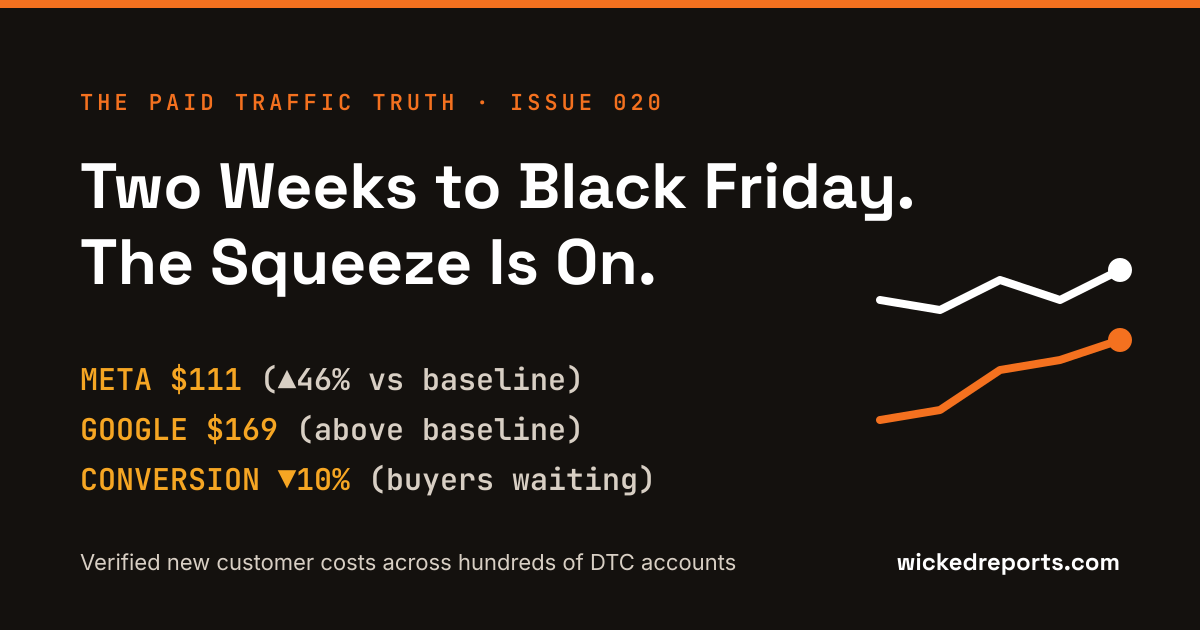
The waiting phase has a price, and this is the week it showed up on both bills. Meta climbed to $111, 46% above its September baseline. Google crossed above its own baseline for the first time since the ramp began. Conversion fell 10% on both as shoppers built carts and refused to buy. Two weeks out from Black Friday, the market is paying its highest verified new customer costs of the fall precisely because nobody is converting yet. That is the squeeze, it is temporary, and this issue is about not flinching inside it.
This week's number
Both giants are now above baseline: Meta at $111, up 46% on September, and Google at $169, with conversion down 10% on each as buyers wait for the deals.
01 / Introduction
The most expensive week to sell is the week before the deals
Last issue covered the loading phase: record spend buying audiences at flat prices. This week the bill for that trade started arriving. Spend eased back about 6% from the record, but the squeeze tightened from both directions anyway, with costs drifting up and intent draining out. Nothing in this week's data is a surprise if you know the calendar, and all of it is alarming if you don't, which is exactly why this is the week dashboards get people in trouble.
This issue covers the squeeze and the one streak running against it, then the same four verified grids as every week: new customer acquisition, first click versus last click, overall channel performance, and new customer lifetime value. All first-party, order-verified data aggregated across hundreds of Wicked Reports accounts. No modeling, no surveys.
02 / Analysis
Both giants above the line, for opposite-of-worrying reasons
Here are the two largest channels across the six weeks of Q4 so far, each against its September baseline.
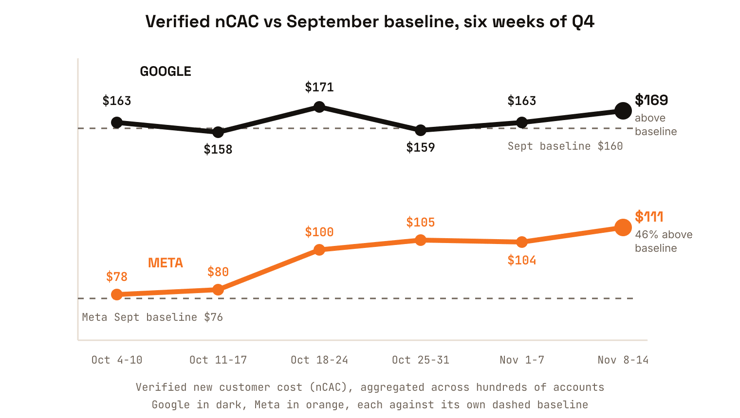
Meta's climb to $111 came from both directions at once this week: click prices up 5% and conversion down 10%, the auction and the shopper squeezing together. Its quality held at 86% verified new buyers with a 16% markup over blended CAC, so the premium is still buying real growth, just at the fall's highest price. Google's move to $169 is the newer development: search had dodged the ramp for a month on high-intent researchers, and this week its conversion fell 10% too, with click prices actually down 6%. When even the people typing queries stop buying, the wait has reached every layer of the funnel. Organic conversion falling 22% says the same thing louder.
None of this is deterioration, and the shape of the data is the proof. Costs rising while click prices are flat or falling, on every channel at once, two weeks before the biggest deal window of the year, is shoppers delaying purchases they have already decided to make. The carts are building. The lists are growing. The buying is scheduled. The verified nCAC you see this week and next is the fall's worst, because the denominator is on hold, and the brands that treat these two weeks as a performance crisis will cut exactly the spend that was about to pay off. Last issue's guidance stands and hardens: grade these weeks on click cost, audience volume, and new-buyer share, and hold the verdict until the deal window has run.
Two channel notes inside the squeeze. YouTube posted this series' first four-digit week at $1,007 per verified new customer, click prices up another 38%, which is the holiday brand-money flood reaching its peak in video auctions; at 4.5% of tracked spend and swinging violently week to week, it is the extreme case of the feed tax, not a new story. And TikTok ran the other way for a fourth straight week: $85, $83, $66, now $60, on growing volume, with the best new visit to customer conversion in the entire grid at 5.2%. Four weeks is the length of run this series took seriously when Meta did it in September, so it gets taken seriously here: the price trend is real. What has not moved in those four weeks is the quality: 52% new buyers and a 94% markup, meaning nearly half of what TikTok sells at that attractive price is repeat business. A real streak and a real asterisk, both at once.
03 / New Customer Acquisition
The full acquisition picture, by channel
| Channel | % new | nCAC | New visit → customer | WoW conv. |
|---|---|---|---|---|
| Meta | 86% | $111 | 2.0% | ▼ 10% |
| Organic | 48% | — | 0.9% | ▼ 22% |
| 65% | $169 | 1.9% | ▼ 10% | |
| Other | 76% | — | 2.5% | ▲ 18% |
| TikTok | 52% | $60 | 5.2% | ▲ 15% |
| 24% | — | — | — | |
| Influencer | 64% | — | 1.9% | ▼ 12% |
| Microsoft | 57% | $215 | 1.2% | ▼ 6% |
| SMS | 32% | — | — | — |
| AI Assistant | 83% | — | 2.5% | ▲ 5% |
| YouTube | 70% | $1,007 | 0.3% | ▼ 14% |
| Pinterest * | 69% | $620 | 0.2% | ▼ 41% |
The conversion column is the squeeze in one glance: down on eight of the ten channels with data, and the two that rose are small slices. Microsoft held flat at $215, pausing its autumn climb without reversing it. The AI assistant channel keeps quietly compounding, one of only two conversion gainers this week at an 83% new-buyer share that most paid channels would envy.
04 / First Click vs Last Click
Two models, and the gap is about to peak
| Channel | First click ROAS | Last click ROAS | Credit gap | Read |
|---|---|---|---|---|
| Meta | 0.49 | 0.35 | −0.14 | Under-credited on last click |
| 1.76 | 1.92 | +0.16 | Over-credited on last click | |
| Microsoft | 2.25 | 2.95 | +0.70 | Over-credited on last click |
| YouTube | 0.52 | 0.45 | −0.07 | Under-credited on last click |
| Pinterest * | 0.48 | 0.37 | −0.11 | Under-credited on last click |
| TikTok | 0.17 | 0.24 | +0.07 | Over-credited on last click |
The measurement warning of the last three issues reaches its most practical form this week. The clicks being paid for right now, at the fall's highest prices, will convert during the deal window through emails, SMS sends, and branded searches. On a last-click view, the next three weeks will make this week's spend look like the problem and the closing channels look like heroes. Both readings describe the same customers. Decide before Black Friday which model your December budget meeting will use, and make sure everyone in the room knows which question it answers.
05 / Overall Channel Performance
Where the money goes, and the true cost of a new customer
| Channel | Spend share | CPC | aCAC | nCAC | nCAC markup | ROAS |
|---|---|---|---|---|---|---|
| Meta | 50.5% | $1.03 | $96 | $111 | 16% | 0.52 |
| 39.0% | $1.71 | $110 | $169 | 54% | 1.41 | |
| YouTube | 4.5% | $1.52 | $709 | $1,007 | 42% | 0.25 |
| Microsoft | 3.5% | $1.18 | $123 | $215 | 75% | 1.80 |
| TikTok | 2.4% | $0.82 | $31 | $60 | 94% | 1.09 |
| Pinterest * | 0.1% | $0.73 | $427 | $620 | 45% | 0.17 |
The TikTok row is this grid's teaching moment this week. A $31 blended CAC is the kind of number that gets a channel scaled in a Friday meeting, and the 94% markup beside it is the reason to pause: the true cost of a genuinely new customer there is nearly double the blended figure, because almost half its buyers already knew the brand. The gap between those two numbers is the entire argument for separating nCAC from aCAC, and this week TikTok is the cleanest live example in the set.
06 / New Customer Lifetime Value
What a new customer becomes over a year
| Channel | Day 0 | 30 day | 90 day | 180 day | 1 year | Day 0 → 1yr |
|---|---|---|---|---|---|---|
| Meta | $75 | $91 | $103 | $110 | $114 | 1.53x |
| $195 | $217 | $235 | $247 | $254 | 1.30x | |
| Microsoft | $268 | $304 | $343 | $371 | $389 | 1.45x |
| YouTube | $96 | $235 | $252 | $258 | $262 | 2.73x |
| Organic | $215 | $254 | $287 | $310 | $323 | 1.50x |
| $220 | $269 | $319 | $350 | $368 | 1.67x | |
| SMS | $150 | $184 | $225 | $253 | $272 | 1.82x |
| Influencer | $209 | $278 | $289 | $296 | $305 | 1.46x |
| AI Assistant | $279 | $311 | $340 | $353 | $359 | 1.29x |
| Other | $417 | $482 | $525 | $549 | $560 | 1.34x |
| Pinterest * | $102 | $135 | $170 | $245 | $329 | 3.24x |
| TikTok | $82 | $96 | $141 | $173 | $192 | 2.33x |
The value side keeps not moving, which remains the point. Meta's one-year value sits at $114 against this week's $111 cost, so on click-credited revenue alone the market is paying full value up front for squeeze-week customers, the thinnest spread of the fall. That math only works if those customers return through the deal window, which is the entire premise of the last month's spending, and it is also why the squeeze is survivable: the value curve the market is buying against has held steady through every week of cost noise. The standing caveat applies: this grid blends brands at very different price points, so treat it as a directional market benchmark, not a promise for any one store.
07 / Conclusion
Hold. The window is two weeks out.
Everything in this week's data points one direction: the market is in maximum pre-deal tension, paying the fall's highest verified costs into its lowest conversion, on purpose, with the release two weeks away. The move this week is restraint. Hold the plan you loaded, keep grading these weeks on click cost, audience volume, and new-buyer share, and resist every instinct the dashboard triggers, because the cut you make this week comes out of Black Friday's revenue, not this week's.
And set one thing up before the window opens: know where your verified numbers will land each morning of the deal stretch, not platform-reported, verified against orders. The weeks everyone just paid for get decided in about ten days, the daily swings will be violent, and the brands that come out of it right will be the ones reading true numbers while everyone else reads the platforms' graded-their-own-homework versions. Next issue is the last one before it starts.
See your own version of these four grids
Your real nCAC next to your aCAC, your first versus last click gap, your new customer LTV by channel, in your own account.
Book a demoHow this week's numbers were built. Aggregated across hundreds of Wicked Reports client accounts for the week of Nov 8 - Nov 14, 2026, except first click vs last click, which uses a rolling 90 day window. Multi-week figures reference the prior weekly issues of this series. New versus repeat is verified at the order level against first party order IDs, not modeled and not surveyed. nCAC is the cost to acquire a first time customer. aCAC is the cost to acquire any customer, including existing customers repurchasing. Channels without cost data, including email, SMS, organic, influencer, and AI assistant traffic, are left out of the cost comparisons. Channels marked with * carried very few new customers this week and are excluded from all conclusions. Snapchat is excluded from this report because it logged no verified new customers this week. Two source rows, Pre-Wicked and Unattributed, are excluded from the lifetime value grid because they describe tracking status rather than an acquisition channel. The channel labeled Facebook in the underlying platform data is shown here as Meta. Charts and tables carry meaning through direction, labels, and contrast rather than color alone.
The Paid Traffic Truth · Wicked Reports · wickedreports.com