Frame 131-4
 

The 5 Forces in Action:
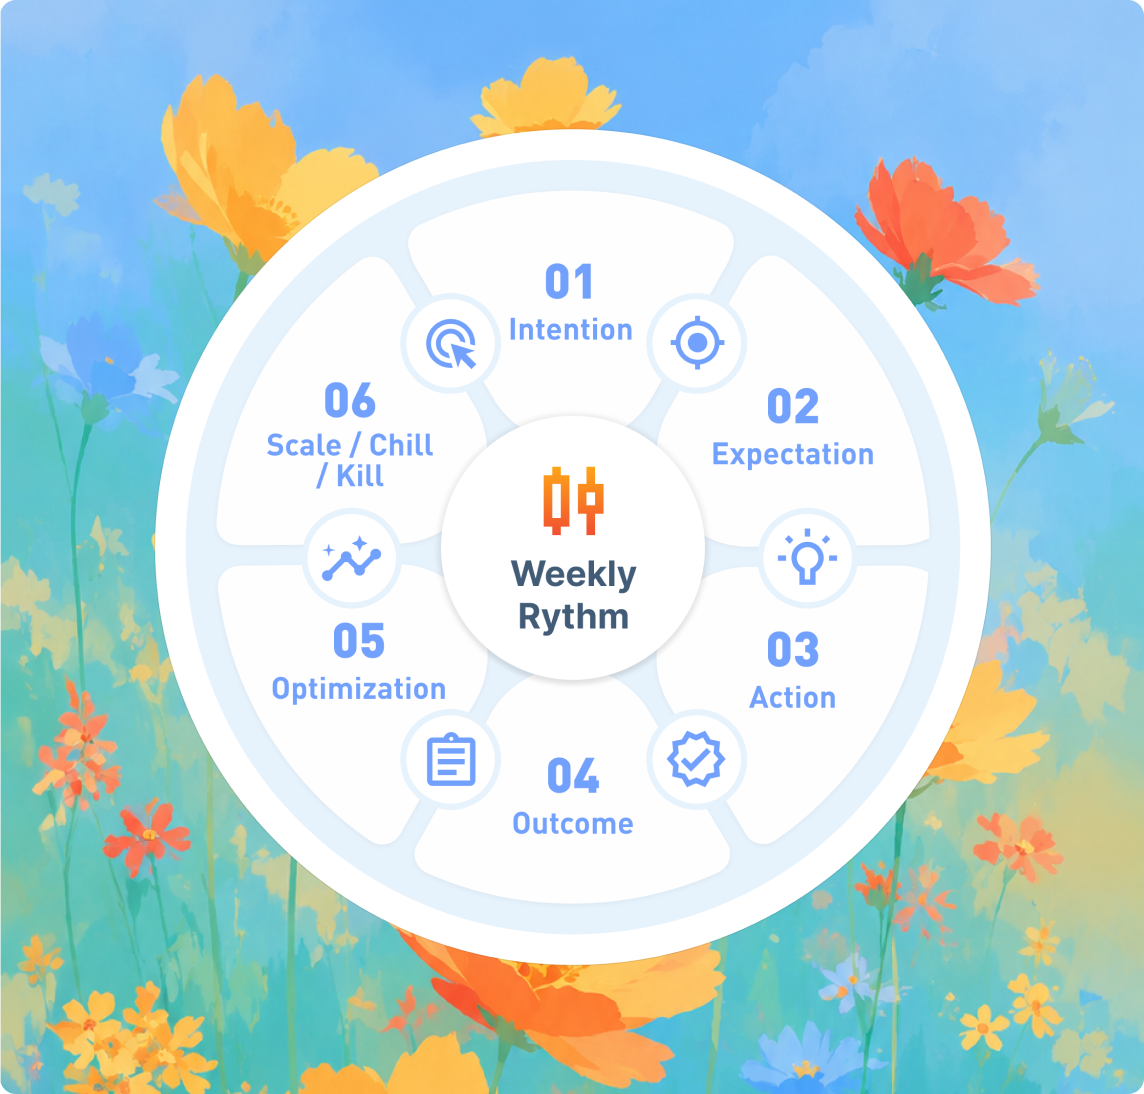
Your Weekly Scale / Chill / Kill System for New Customer Growth


Undeline

The goal isn’t more dashboards. The goal is a weekly operating rhythm that tells you what to do with your budget — based on verified first-party outcomes and the reality of how new customers get created.

 
Watch the Instant Demo
See 5 Forces AI in Action
Hero

“Why Growth Feels Fragile Even When ROAS Looks Great

Vector 12-2

dangerous
 
If you can’t separate new customers from repeat buyers, your reporting becomes misleading — and your budget decisions become risky.


When measurement is unclear, the platform’s incentives become your strategy.
This is how teams end up stuck in the same loop:
  • Retargeting looks like growth because it converts fast
  • Prospecting looks unprofitable because it converts slower
  • Platforms over-credit themselves
  • Teams argue because nobody can prove what’s real
  • Decisions slow down — or become emotional

How the 5 Forces Convert Attribution Into a Weekly Decision Plan

Vector 144


THE 5 FORCES IS NOT A REPORT. IT’S A PROCESS. HERE’S HOW IT RUNS IN THE REAL WORLD: 

FORCE 1
 
Intention
 
Pick the Job
You define what each campaign is meant to accomplish and Wicked assigns the correct North Star KPI:
•  New Customer Acquisition → nCAC
•  Top of Funnel Cold Traffic → First-Click ROAS
•  Retargeting / Bottom of Funnel → Multi-Touch ROAS
FORCE 2
 
Expectation
 
Set the Window +
Decision Boundaries
You set the correct attribution window:
•  NCA + TOF typically require 30 days
•  BOF / retargeting typically uses 7 days
Then you define Scale / Chill / Kill zones based on the North Star KPI.
Example: If Chill Zone nCAC = $40–$50 → Scale below $40 → Kill above $50.
FORCE 3
 
Action
 
Execute One Clear Verb
Instead of 40 metrics and opinions, you get one verb per campaign:
•  Scale
•  Chill
•  Kill
And you keep a simple decision log so learning compounds.
FORCE 4
 
Outcome
 
Verify What Actually
Happened
Outcome connects the decision to proof:
•  Verified orders + customer IDs
•  New vs repeat segmentation
•  Real revenue and ROI (not modeled narratives)
FORCE 5
 
Optimization
 
Use Evidence to Improve
Optimization is where you diagnose constraints and apply fixes:
•  Creative
•  Offer
•  Structure
•  Funnel/landing conversion
•  Signal quality
The output is simple:
A weekly plan you can defend.

What Changes When You Run This Weekly

Vector 12-2

Check
You stop “buying your own customers” and calling it performance.
Check
You stop killing prospecting just because it’s slower.
Check
You gain confidence to scale because outcomes are verified.
Check
Your team moves faster because decisions are structured.
Check
Waste becomes obvious — and easier to cut.

The Weekly Decision Rhythm
(What Monday Looks Like)

Vector 13-2


This is how Wicked turns attribution into an operating system — not a reporting project.
 
1
Check campaigns by Intention
2
Review correct window
3
Compare to zones
4
Execute Scale/Chill/Kill
5
Log decision & Review outcomes
The Weekly Decision Rhythm  (What Monday Looks Like)