The Paid Traffic Truth — Issue 001
The Wicked Reports Weekly · Week of Jun 21–27 2026 · Verified first-party order data · vs previous period
Across every paid channel this week, a new customer cost 20% to 60% more than your blended CAC. If your acquisition goal was built on that blended number, you are quietly starving top of funnel.
01 / INTRODUCTION
Welcome to the first edition of the Paid Traffic Truth report. Every week I feature one story from the world of paid traffic in the Analysis section, then give you all four grids underneath it - new customer acquisition, first click vs last click, overall channel performance, and new customer lifetime value. All of it comes from Wicked Reports top of funnel new customer attribution and LTV, aggregated across hundreds of client accounts and verified against real orders.
This week's featured story is nCAC vs aCAC, channel by channel.
New customers cost more than your dashboard says
This week's story is the gap between two numbers that look almost the same and are not.
nCAC = cost to acquire a new customer.
aCAC = cost to acquire any customer.
All new versus any customer data is validated against first party order IDs.
The cost to acquire a new customer this week ran $20 to $55 higher than the cost to acquire any customer. And that any customer number includes your existing customers coming back to repurchase, which is exactly why it looks cheaper than it is.
Microsoft is the sharpest example. On a blended basis a customer looks like $86. A brand new one actually costs $141, a 64% markup you never see if you only watch blended CAC. Google tells the same story at the biggest spend level in the set, $74 blended against $105 for a new customer.
Factor that markup into your nCAC goals. Start with your aCAC, spend divided by total customers. Then add at least 20% to reach a realistic new customer cost, and if you lean on search, assume a lot more. The gap this week ran from about 20% at the low end to more than 60% on Microsoft.
Now the part that quietly costs brands their growth. I see this happen constantly. Spend gets cut at top of funnel because it does not hit a CAC goal. But that goal's foundation included repeat purchasers. So you get a hamster wheel. You cut spend at TOF, you see great numbers in Meta or Google or wherever, and your bottom line new customer growth stalls.
Realistic nCAC goals are the place to start fixing that.
03 / New Customer Acquisition
nCAC vs aCAC, every paid channel
A high nCAC is only a problem if the customer never returns. New-customer value at 30, 90, 180, and 365 days tells you which expensive channels are actually your best ones.
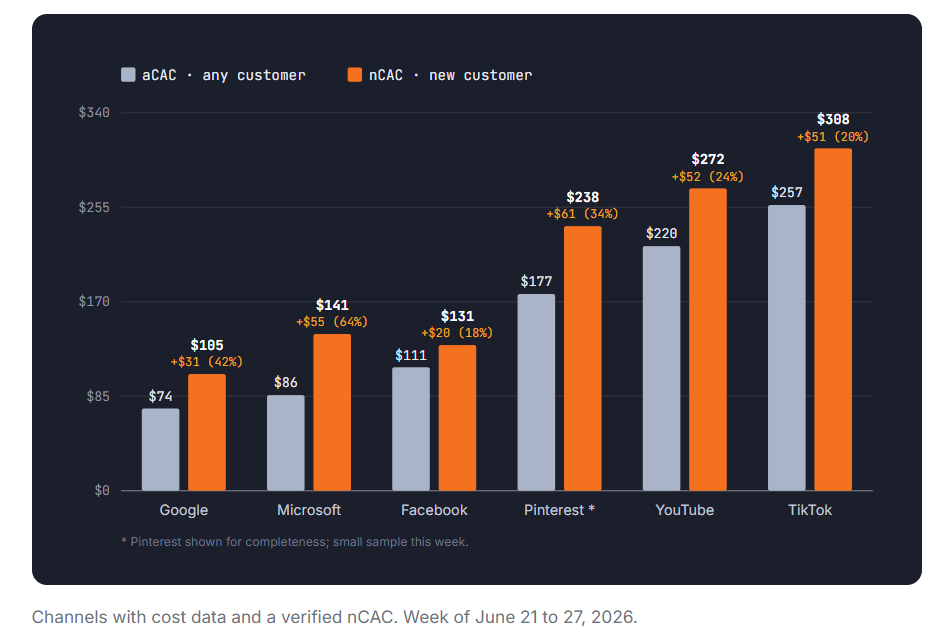
The orange bar sits above the light bar on every single channel. The two that look cheapest on a blended basis, Google at $74 and Microsoft at $86, carry the widest jump to their true new customer cost. Cheap looking is not the same as cheap.
04 / First Click vs Last Click
Who starts the sale vs who takes the bow
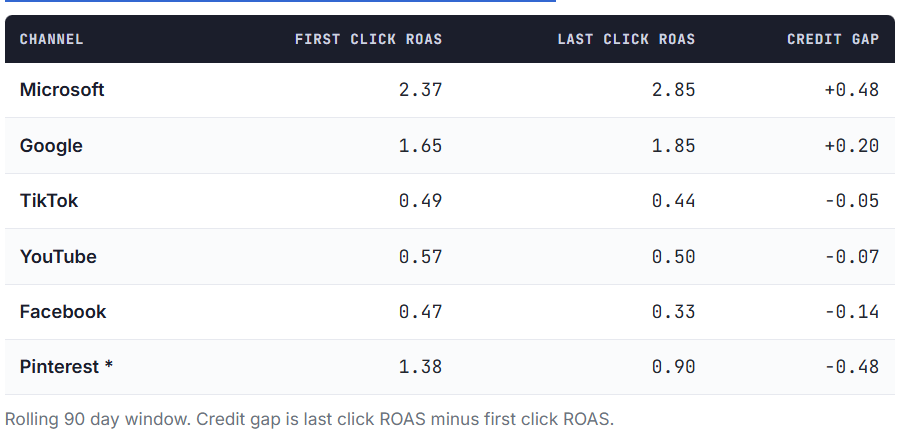
Microsoft and Google post the strongest last click ROAS because they are usually the final step before a purchase. But the prospecting channels that introduce customers, Facebook, Pinterest, TikTok, YouTube, all read higher on first click than last, so a positive credit gap means last click is taking credit and a negative one means last click is giving it away. Judge a discovery channel on last click alone and you cut the thing that started the sale. More on this gap in a future edition.
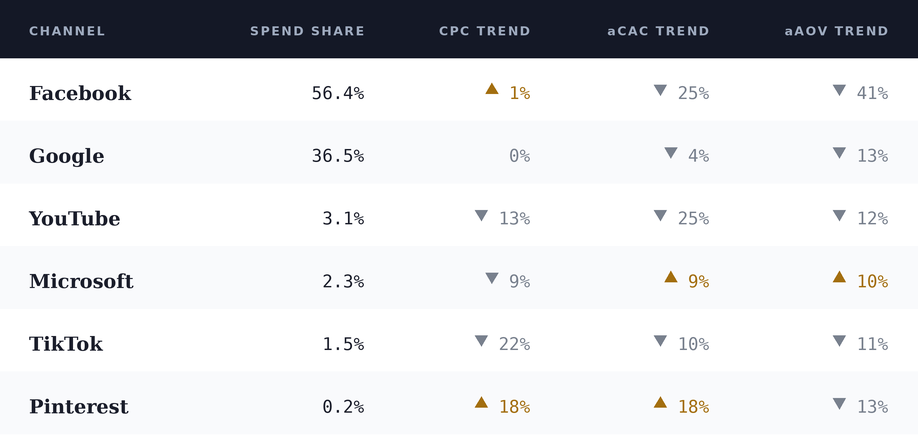
Two channels own this market. Facebook is 56% of tracked spend and Google another 37%, so about nine dollars in ten flow through Meta and Google. aCAC came down on most channels this week, and Facebook's average order value fell 41%, which at this scale reads as calendar and mix rather than a change in behavior. Read the direction of the trend, not any single week in isolation.
06 / New Customer Lifetime Value
What a new customer becomes over a year
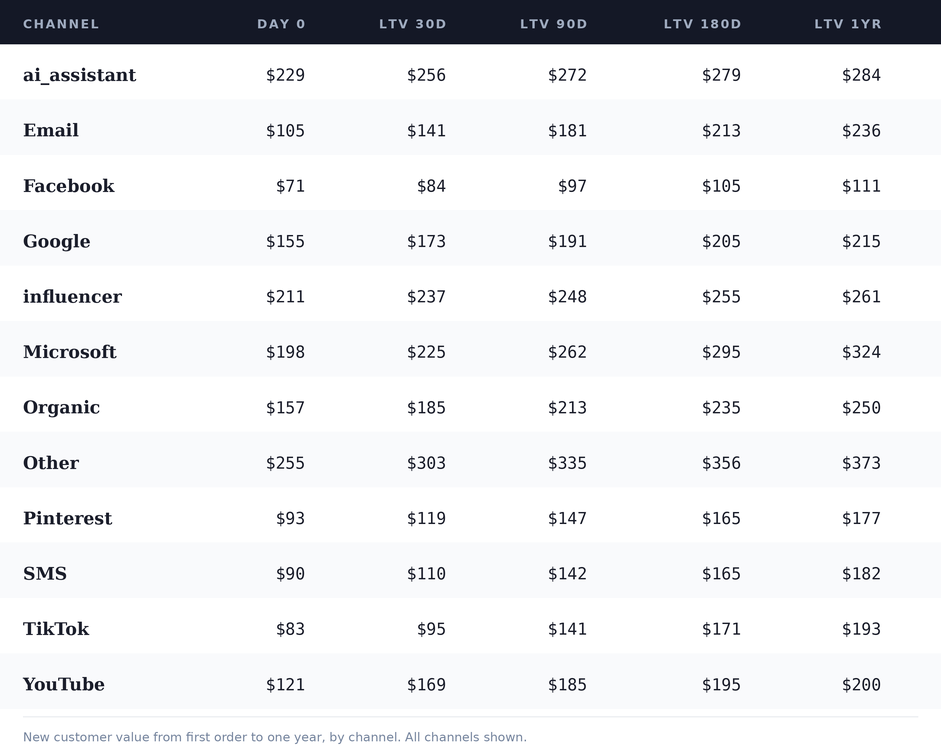
Microsoft and Google produce the most valuable new customers over a year, $324 and $215, and both clear their new customer CAC comfortably. The prospecting channels tell a growth story of their own. A new TikTok customer is worth about 2.3 times their first order value by the one year mark, Pinterest about 1.9 times. Facebook is the mirror image, cheap to acquire but the lowest one year value in the set at $111, a low AOV high frequency profile. One honest caveat. This blends hundreds of brands at different price points, so read it as a directional benchmark for the market, not a promise for your specific store.
07 / Conclusion
Measure new versus repeat, then decide
The thread through all four grids is the same. The numbers your ad platforms and your dashboard hand you, blended CAC, last click ROAS, a single week's ROAS, all flatter the channels that close and hide what a new customer truly costs and returns. Measure new versus repeat at the order level and the picture changes, sometimes enough to change where your next dollar goes.
See your own four grids
Your real nCAC next to your aCAC, your first versus last click gap, your new customer LTV by channel, in your own account.
How this week's numbers were built. Aggregated across hundreds of Wicked Reports client accounts for the week of June 21 to 27, 2026, except first click vs last click, which uses a rolling 90 day window. New versus repeat is verified at the order level against first party order IDs, not modeled and not surveyed. aCAC is spend divided by all customers. nCAC is spend divided by verified first time customers. Channels without cost data, including email, SMS, organic, and influencer, are left out of the CAC comparison and the chart. Charts and tables separate series by light and dark contrast, direct labels, and direction glyphs rather than color alone.