The Paid Traffic Truth — Issue 004
Published July 20,2026 * Data for the week of July 12 to July 18 2026 * Aggregated across hundreds of Wicked Reports accounts.
We said the ROAS trap was structural. A week later, the gap got wider
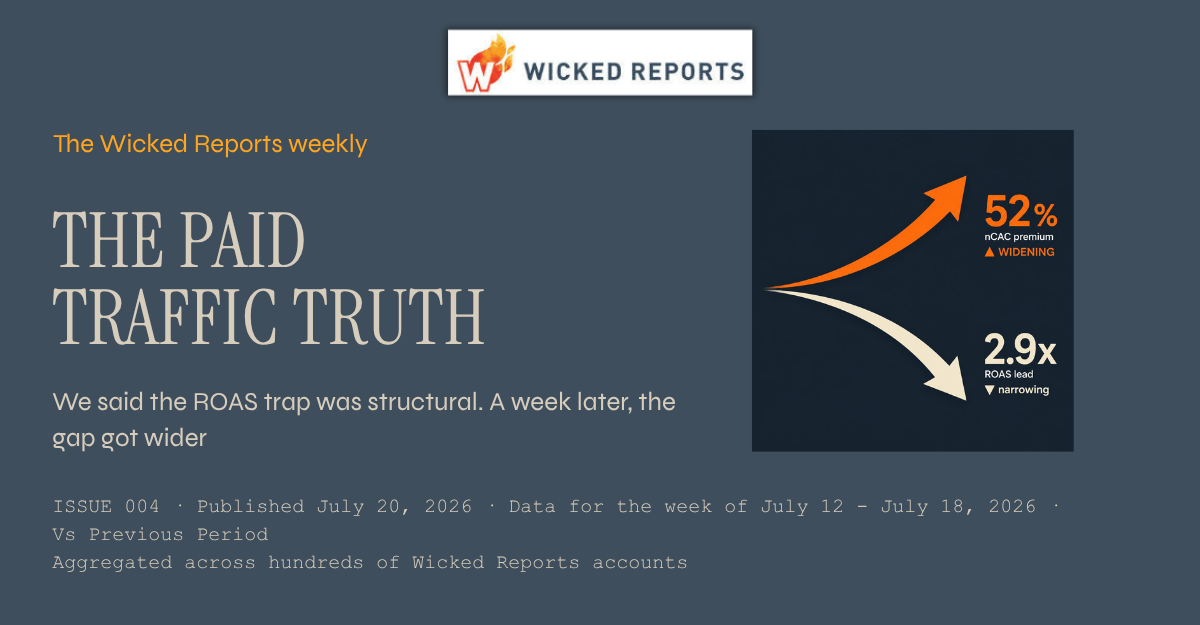
Last week I told you the ROAS trap was structural, not a July 4 hangover, and that it would look the same seven days later. It did. The only thing that changed is the gap got wider. Google's new customer went from 39% more expensive than Meta's to 52% more, while Google's ROAS lead over Meta actually shrank.
This week's number
Google's new customer cost 52% more than Meta's this week, up from 39% last week. In the same seven days, Google's ROAS lead over Meta narrowed from 3.1x to 2.9x. The two numbers are moving in opposite directions.
01 / Introduction
A follow up, because the data asked for one
Welcome to the fourth edition of the Paid Traffic Truth. Normally I bring you a new story each week. This week the data made me do something different and more useful. It let me check my own homework.
Last week's story was that ROAS ranks your channels backwards, because it fuses the cost of a new customer with the value of that customer and hides both. I said that pattern was structural, not a holiday artifact and that it would still be true after the July 4 noise cleared. This is the week that noise cleared. So let's see if it held. Every number below is first party and order verified, aggregated across hundreds of ecommerce brands.
02 / Analysis
It held. And the trap got more expensive.
Here is the honest test. If last week's ROAS trap were a July 4 mirage, this week it would soften. Search would stop looking artificially efficient, Meta would stop looking artificially weak, and the gap between reported ROAS and true new customer cost would close.
The opposite happened. Meta held the cheapest new customer in the set at $84, exactly where it was last week. Google's new customer climbed from $117 to $128. So the premium you pay for a new customer on Google, the channel that looks better on ROAS, went from 39% to 52% in one week. Microsoft, still the best ROAS in the set at 2.32, saw its new customer cost jump to $161, a 73% markup over its own blended number, up from 64%.
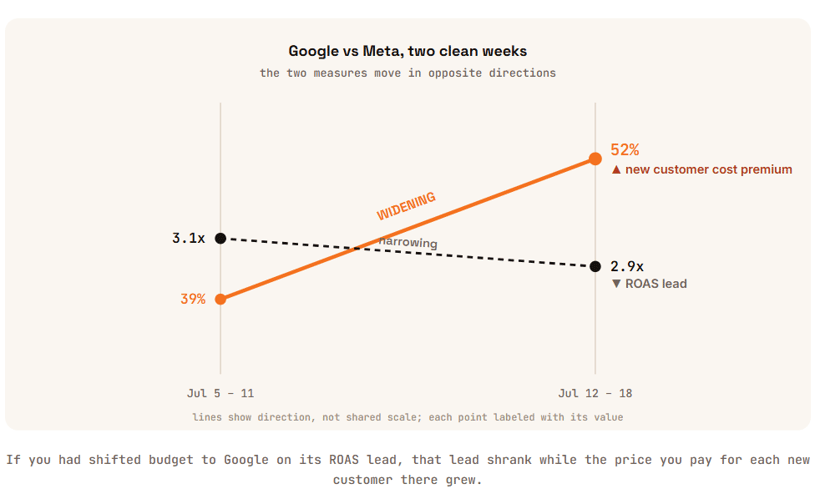
Sit with what that means for a budget decision. If you had watched the ROAS column last week and moved money toward Google, this week that channel's ROAS advantage got smaller and the price you paid for each new customer got bigger. You would have chased a lead that was closing while paying a premium that was rising. ROAS pointed you one way. The truth walked the other.
Here is the calendar check, because this report only works if I am honest about it. Last week you could have accused me of July 4 residue. This is the second full week clear of the holiday. The pattern did not fade, it sharpened. Two clean weeks, same direction, wider gap. That is the definition of structural. Search and Microsoft close demand and read high on ROAS. Meta prospects and reads low. It is not seasonal, and it will not fix itself.
03 / New Customer Acquisition
The full acquisition picture, by channel
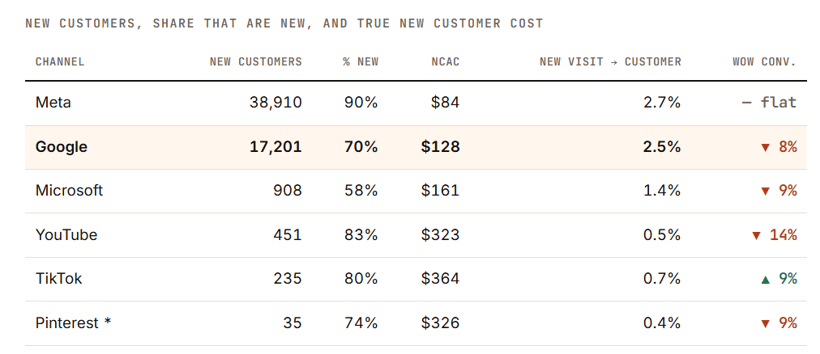
Meta held its new customer cost flat at $84 and stayed the prospecting engine, with 90% of the customers it touched brand new. Google's cost rose while its new customer volume and conversion both slipped. That is the shape of the whole story in one row. The cheap acquisition channel held, the expensive one got more expensive. Pinterest ran on a tiny base again this week and carries an asterisk, so it is not anchoring anything.
04 / First Click vs Last Click
Who starts the sale vs who takes the bow
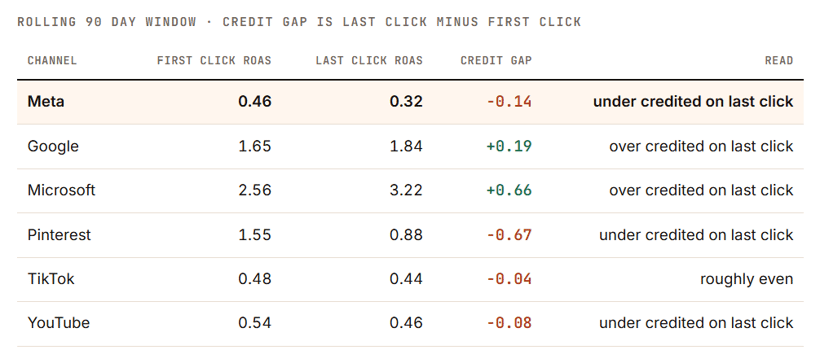
This is the engine under the trap, and it barely moved, which is the point. Last click, the model closest to what the platforms report, still inflates Google and Microsoft, the channels that close, and still shrinks Meta, the channel that opens. Meta gives back 0.14 of ROAS on last click. Microsoft gains 0.66. A rolling 90 day window does not swing on a holiday, and it did not. The credit is being handed to the closer, week in and week out.
05 / Overall Channel Performance
Where the money goes, and THE TRUE COST OF A NEW CUSTOMER 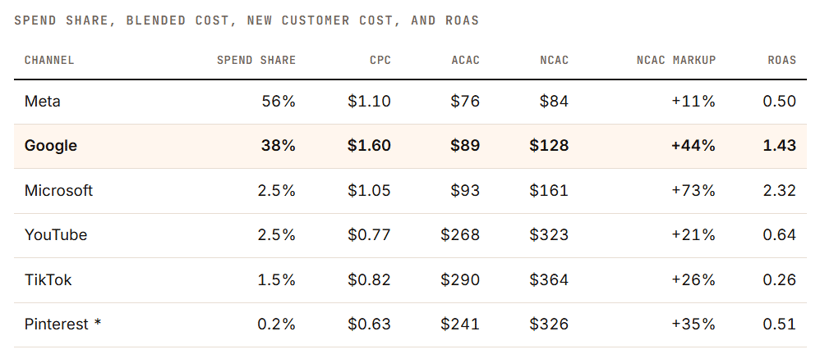
Meta and Google are again about 94% of tracked spend, so read those two rows together. Google's ROAS slipped from 1.59 to 1.43 while its new customer cost rose from $117 to $128. Both moved against you at once, and ROAS only showed you one of them. The markup column tells the same story it told last week, only louder. The gap between blended and true new customer cost is widest exactly where ROAS looks best. Microsoft's 73% markup is the cleanest example in the set.
06 / New Customer Lifetime Value
What a new customer becomes over a year
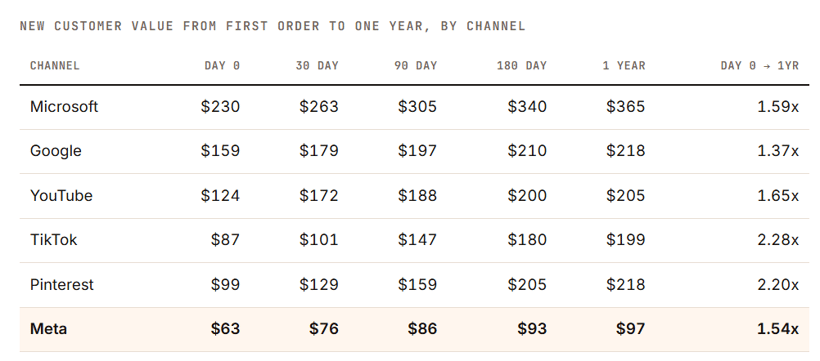
The value grid is the piece that keeps the story honest. Meta is the cheapest new customer to acquire and the lowest one year value at $97. Microsoft is the most expensive to acquire and the highest one year value at $365. This is why the answer is never simply buy Meta and cut Google. The point is that cost and value are two separate facts, and ROAS shows you neither. One caveat that always applies here. This blends hundreds of brands at different price points, so read it as a directional market benchmark, not a promise for your store.
07 / Conclusion
A pattern that survives a second week is a pattern you budget around
One week of a surprising number is a curiosity. Two clean weeks of the same number, moving further in the same direction, is a pattern. The ROAS trap is not a July 4 story and it is not going to correct itself, because it is built into how the models assign credit. The closer gets the bow. The opener gets cut.
You do not fix this with a better dashboard. You fix it with two verified numbers standing next to each other, the cost of a new customer and the value of that customer over time. Watch those instead of ROAS and the budget decision stops moving against you.
How this week's numbers were built. Aggregated across hundreds of Wicked Reports client accounts for the week of July 12 to July 18, 2026, except first click vs last click, which uses a rolling 90 day window. New versus repeat is verified at the order level against first party order IDs, not modeled and not surveyed. The new visit to new customer conversion rate credits the channel that originated the new visit. Channels without cost data, including email, SMS, organic, and influencer, are left out of the cost comparisons. Snapchat is excluded for negligible spend. Pinterest is marked with an asterisk because it ran on a small number of new customers this week, so it is not used to anchor any headline. The channel labeled Facebook in the underlying platform data is shown here as Meta. Charts and tables carry meaning through direction, labels, and contrast rather than color alone.

.png)