

10 min read
The Paid Traffic Truth : Why Last-Click Attribution Cuts Meta's ROAS and Pays Search
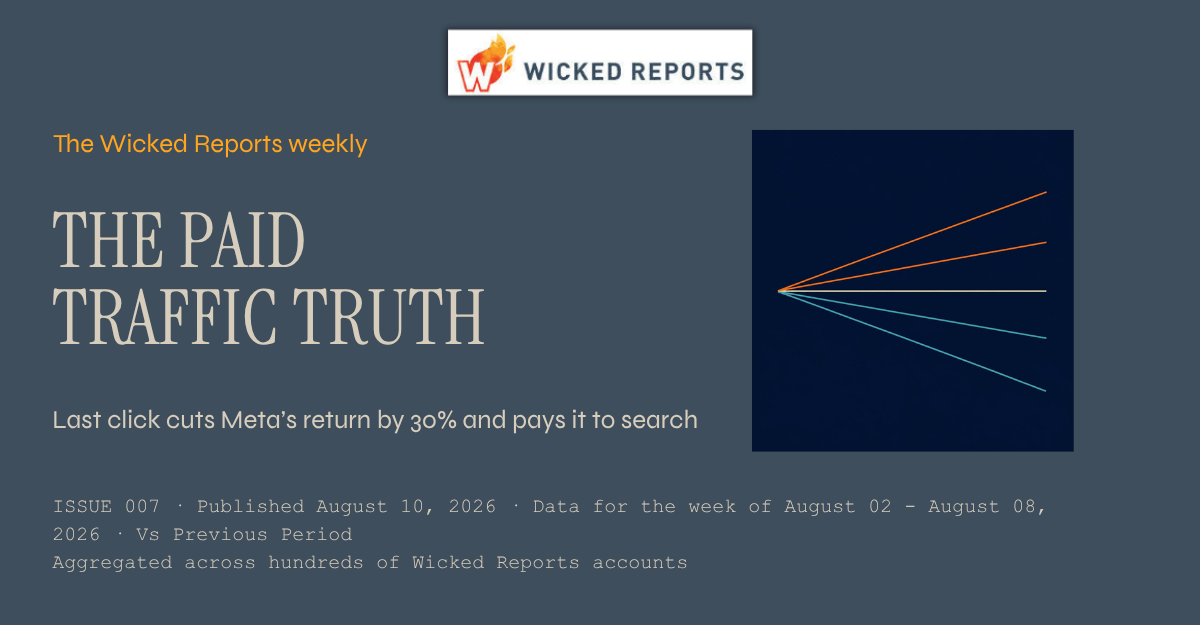
The Paid Traffic Truth — Issue 007
Published August 10,2026 * Data for the week of August 02 to August 08 2026 * Aggregated across hundreds of Wicked Reports accounts.
Last click cuts Meta’s return by 30% and pays it to search
I ran the same 90 days of verified orders through two attribution windows this week and got two different winners. On first click Meta returns 0.43 and Google returns 1.54. On last click Meta drops to 0.30 and Google climbs to 1.72. If your budget meeting uses the second number, you are about to defund the channel that started the sales you are celebrating.
This week's number
Move from first click to last click and Meta’s ROAS falls 30%, while Google’s rises 12% and Microsoft’s rises 22%. Same orders, same revenue, same 90 days. Only the credit moved.
01 / Introduction
Two attribution windows, two different winners, one set of orders
Every week I pull new customer economics from hundreds of Wicked Reports accounts, verified at the order level against first party order IDs. Not modeled. Not surveyed. This week the interesting number is not a performance number at all. It is an accounting number.
Below you get the story first, then the four grids: new customer acquisition, first click versus last click, overall channel performance, and new customer lifetime value. The story this week is what happens to your channel ranking when you change nothing except which click gets the credit.
02 / Analysis
Nobody performed differently. The credit moved.
Take every order in the trailing 90 days and give 100% of the revenue to the first click that touched it. Then run it again and give 100% to the last click. Same orders, same revenue, same spend in the denominator. The only thing that changes is who gets paid on paper. Here is what that swap does to each channel, with every channel indexed to its own first click result so you can see the direction rather than the absolute level.
Meta loses 30% of its measured return on the switch. Google gains 12% and Microsoft gains 22%. YouTube loses 16%. The pattern is not random and it is not about ad quality. Social channels get found early in a buying decision, and search gets typed in at the end, so a last click model quietly hands social’s work to search and calls it search performance. The acquisition grid says the same thing from the other direction: 90% of Meta’s customers this week were brand new, against 66% on Google and 58% on Microsoft. The channel bringing you the most first time buyers is the channel last click punishes hardest.
Is this a calendar effect? The first week of August is a quiet stretch, past the July promo cycle and not yet into back to school and Labor Day, so a soft social week would be an easy explanation. I do not think that is what this is. The first click versus last click comparison runs on a rolling 90 day window, not on the week, and the direction of the gap has been consistent: prospecting channels open sales and search closes them. That makes it structural, and structural means it will be true again next week. The number I would treat as genuinely calendar sensitive is Google’s nCAC, up 12% week over week to $148, with the click price up about 5% and new customer conversion down about 4%. That is a mix and auction move worth watching, not a verdict.
03 / New Customer Acquisition
The full acquisition picture, by channel
Read the last two columns together. Meta converts new visits to new customers at 2.5% and delivers new customers at $96, and 90% of what it delivers is a first time buyer. Google converts at 2.3% but a new customer costs $148, and a third of its customers were already yours. Microsoft is the most expensive new customer in the set at $160 and the least new at 58%. YouTube and TikTok are prospecting channels that are honest about it: 82% and 77% new, at $395 and $344. Pinterest is marked with an asterisk because it produced very few new customers this week, so its rates swing wildly and it anchors nothing in this issue.
04 / First Click vs Last Click
Who starts the sale vs who takes the bow
The credit gap column is last click minus first click. Negative means the channel starts sales it does not get paid for. Meta and YouTube are both under credited, Google and Microsoft are both over credited, and TikTok is close to even. Microsoft has the widest single gap at 0.56, which is a good reminder that a 3.07 ROAS on a closing channel is not the same claim as a 3.07 ROAS on a channel that found the customer. If you only ever look at one of these two columns, you are not measuring performance, you are choosing a winner in advance.
05 / Overall Channel Performance
Where the money goes, and THE TRUE COST OF A NEW CUSTOMER
Meta carries 55% of tracked spend and posts the weakest headline ROAS of the two big channels at 0.51, and yet it produces the cheapest new customer in the set at $96, only 12% above its blended aCAC. Google is the reverse: a 1.44 ROAS, and a new customer that costs 49% more than its blended number suggests. Microsoft is the sharpest version of the trap, a 2.25 ROAS sitting on a 72% nCAC markup. Note that the ROAS in this grid is the weekly full funnel figure, which is a different measure from the 90 day first and last click columns in section 04. Compare them for direction, not level.
06 / New Customer Lifetime Value
What a new customer becomes over a year
This grid blends brands at very different price points, so treat it as a directional market benchmark rather than a promise for your store. The line I would stare at is Meta: a new customer worth $63 on the first order and $97 after a year, against a $96 nCAC. In aggregate, Meta new customers take a full year to pay back the cost of acquiring them, on revenue, before margin. Google new customers start at $160 and reach $219, so they cover a $148 nCAC much faster. That is the real trade behind the credit argument, and it is why I want both attribution views before I move budget rather than after.
07 / Conclusion
Pick your attribution window before you pick your winner
Nothing in this week’s data says Meta is good and Google is bad. It says the ranking of your channels is partly a choice you already made when you picked an attribution model, and most teams made that choice by accident, by using whatever the ad platform reported. Judge on last click and you will cut the channel that opens sales in order to fund the channel that closes them. Do that for two quarters and the closer runs out of people to close.
The practical fix is small. Put first click and last click side by side, then buy on nCAC and nLTV rather than on either ROAS number alone. This week that means Meta is the cheapest source of first time buyers you have, with a payback period of about a year that you need to underwrite deliberately, and Google is an efficient closer that is being credited for demand it did not create. Both facts are true at once, and you can only see both if you refuse to let one model do all the talking.
How this week's numbers were built. Aggregated across hundreds of Wicked Reports client accounts for the week of August 02 to August 08, 2026, except first click vs last click, which uses a rolling 90 day window. New versus repeat is verified at the order level against first party order IDs, not modeled and not surveyed. The new visit to new customer conversion rate credits the channel that originated the new visit. Channels without cost data, including email, SMS, organic, and influencer, are left out of the cost comparisons. Snapchat is excluded for negligible spend. Pinterest is marked with an asterisk because it ran on a small number of new customers this week, so it is not used to anchor any headline. The channel labeled Facebook in the underlying platform data is shown here as Meta. Charts and tables carry meaning through direction, labels, and contrast rather than color alone.
Topics: Wicked Reports New Customer Acquisition Cost (NCAC) Attribution Window Return on Ad Spend (ROAS) first click vs last click Paid Traffic Truth
10 min read
The Paid Traffic Truth : Why Your Best ROAS Channels Bring the Fewest New Customers
.png)
The Paid Traffic Truth — Issue 005
Published August 03,2026 * Data for the week of July 26 to August 01 2026 * Aggregated across hundreds of Wicked Reports accounts.
WhyYour Best ROAS Channels Bring the Fewest New Customers
A calm week, which is the best time to see a structural truth clearly. Sort your channels by ROAS this week and watch the share of customers who are actually new fall as you climb the list. The channels posting the best returns are the ones doing the least to grow your customer base.
This week's number
Google's ROAS is 3x Meta's, yet 89% of Meta's customers are brand new against 68% of Google's. Microsoft posts the best ROAS in the set at 2.76 and the lowest new share at 59%. The better the ROAS, the more of it is repeat business.
01 / Introduction
A quiet week, and two things that settled down
Welcome to the sixth edition of the Paid Traffic Truth. This was a quiet week, and I am not going to dress it up. Two things I flagged recently both settled in the calm direction. Meta's late July cost bump leveled off, with new customer conversion ticking back up a touch, which is what you would expect if that was a seasonal dip rather than a real problem. And Microsoft's ROAS, which had slipped three weeks running, bounced back this week.
With no fire to put out, a quiet week is the right time to look at something that is always true but easy to miss when a number is jumping around. It sits in plain sight in this week's grids. Every figure is first party and order verified, aggregated across hundreds of ecommerce brands.
02 / Analysis
Rank by ROAS and the new-customer share runs the other way
Take this week's channels and line them up by ROAS, best to worst. Microsoft leads at 2.76, then Google at 1.54, then the video and social channels trail with Meta at 0.51 and TikTok at 0.27. Standard picture. Now add one column next to it: the share of each channel's customers who are actually new to the brand.
The two columns point in opposite directions. Microsoft, the ROAS leader, is only 59% new. Google is 68% new. Meta, near the bottom on ROAS, is 89% new. YouTube is 85%. The higher a channel sits on ROAS, the smaller the fraction of its customers who are people you did not already have.
This is not a coincidence, it is how the metric is built. A channel like Google or Microsoft captures a lot of demand at the moment of purchase, and a good chunk of that demand is existing customers coming back to buy again. Those repeat orders are cheap to win and they land in the channel's revenue, so its ROAS looks strong. Meta and the video channels spend most of their effort in front of people who have never bought from you, which is harder and converts lower, so their ROAS looks weak even though they are doing the actual work of growing the business.
Put plainly, ROAS quietly rewards a channel for reselling to people you already have. The two dominant channels this week make the point on their own. Google's ROAS is three times Meta's, but roughly a third of Google's customers are repeat buyers, against barely one in ten on Meta. If you shift budget toward the higher ROAS number, you are partly paying to harvest demand you would likely have captured anyway, and starving the channel bringing in new humans.
The honest caveat, because this cuts both ways. A high repeat share is not a sin, closing existing demand efficiently is a real job and someone has to do it. The point is not that Google is bad and Meta is good. It is that ROAS alone cannot tell you which job a channel is doing, and if growth is your goal, the share of new customers belongs right next to the ROAS number, not three columns away. This is a quiet, no-drama week across the board, so read this as a standing structural feature of the data, not a one-week event.
03 / New Customer Acquisition
The full acquisition picture, by channel
Sorted by new share this time, so the pattern from the chart reads top to bottom. Meta and the video channels sit up top doing the prospecting, and by the time you reach the bottom of the list you are looking at the channels with the strongest ROAS. Meta held steady with conversion up a couple of points, the leveling off mentioned earlier. YouTube and TikTok conversion slipped on small volume, so treat those as wobbles. Pinterest ran thin again and carries an asterisk.
04 / First Click vs Last Click
Who starts the sale vs who takes the bow
This grid reinforces the same idea from a different direction. The channels that close, Google and Microsoft, gain ROAS on the last click model, the one closest to what platforms report. The channels that open, Meta and Pinterest, lose it. So the channel doing the most new customer work is also the one most likely to be under credited when you look at platform numbers. Two ways of measuring, same conclusion about who gets shortchanged.
05 / Overall Channel Performance
Where the money goes, and THE TRUE COST OF A NEW CUSTOMER
The markup column tells the same story a third way. Look at where the gap between blended cost and true new customer cost is widest. Microsoft at 69% and Google at 47%. Those are the high ROAS channels, and the wide gap is the tell that a lot of their cheap blended cost is repeat business. Meta's markup is just 12%, because almost everyone it brings in is new, so its blended and new customer costs are nearly the same number. Microsoft's ROAS rebound to 2.76 this week is worth noting after three down weeks, though at 2.4% of spend it does not move the overall picture.
06 / New Customer Lifetime Value
What a new customer becomes over a year
The value grid adds the missing dimension to the whole discussion. A new customer is worth roughly one and a half times their first order within a year on most channels, and more than double on TikTok and Pinterest. That value only accrues if you keep acquiring new customers, which loops right back to the point. The channels earning the applause on ROAS are not the ones filling this table with new names. As always, this blends hundreds of brands at different price points, so treat it as a directional benchmark, not a promise for your store.
07 / Conclusion
ROAS answers a question you did not ask
ROAS tells you how much revenue a channel returned per dollar spent. It does not tell you how many new customers that dollar bought, and this week it quietly told you the opposite, because the highest returns came from the channels doing the least prospecting. On a loud week that is easy to miss. On a quiet week like this one it is sitting right there in the grids.
If growth is the goal, the share of new customers and the verified cost to acquire them belong next to ROAS, not buried three columns over. Watch all three together and you stop mistaking efficient reselling for growth.
How this week's numbers were built. Aggregated across hundreds of Wicked Reports client accounts for the week of July 26 to August 01, 2026, except first click vs last click, which uses a rolling 90 day window. New versus repeat is verified at the order level against first party order IDs, not modeled and not surveyed. The new visit to new customer conversion rate credits the channel that originated the new visit. Channels without cost data, including email, SMS, organic, and influencer, are left out of the cost comparisons. Snapchat is excluded for negligible spend. Pinterest is marked with an asterisk because it ran on a small number of new customers this week, so it is not used to anchor any headline. The channel labeled Facebook in the underlying platform data is shown here as Meta. Charts and tables carry meaning through direction, labels, and contrast rather than color alone.
Topics: Wicked Reports New Customer Acquisition Cost (NCAC) Return on Ad Spend (ROAS) Paid Traffic Truth paid traffic attribution
1 min read
Every Platform Grades Its Own Homework : Scott on the ROAS Trap
I sat down with Aly Hathcock on her podcast Humans of Growth to unpack a problem every ecommerce marketer eventually runs into - the numbers on your dashboard keep improving, but the business isn't actually growing faster.