The Paid Traffic Truth — Issue 005
Published July 27,2026 * Data for the week of July 19 to July 25 2026 * Aggregated across hundreds of Wicked Reports accounts.
Meta got a little more expensive. The click price says it isn't you
Most of the board is quiet this week, which is its own kind of news. One number moved that is worth two minutes: after two weeks pinned at $84, Meta's new customer cost rose to $91. Before you blame your creative, look at what did not move. The click price. What moved was conversion, and it moved across hundreds of accounts at once.
This week's number
Meta's cost to acquire a new customer rose 8% to $91, its first move in three weeks. Cost per click held flat at $1.09. The entire increase came from new customer conversion slipping from 2.7% to 2.4%.
01 / Introduction
Sometimes the report is mostly status quo
Welcome to the fifth edition of the Paid Traffic Truth. Not every week hands you a dramatic reversal, and pretending otherwise is how benchmarks lose your trust. This week Google, YouTube, and TikTok all held roughly where they were. The grids below will look familiar, and that is fine. A steady week is information too.
But one number moved, and it happens to be the biggest channel on the board, so it earns a closer look. Every figure here is first party and order verified, aggregated across hundreds of ecommerce brands.
02 / Analysis
The click price held. Conversion is what moved.
Here is the reflex when your Meta new customer cost jumps. You assume the creative is fatiguing, or the algorithm turned on you, or the auction got more expensive. So you start tearing things apart. This week the aggregate data says slow down, because the usual suspect has an alibi.
Meta's cost per click this week was $1.09. The week before it was $1.10. It did not move. If the auction had gotten more expensive, that is the number that would have climbed, and it didn't. So the 8% rise in new customer cost, from $84 to $91, did not come from paying more for traffic.
It came from the other side of the equation. The rate at which a new visitor turned into a new customer fell from 2.7% to 2.4%, an 11% drop. Same priced clicks, fewer of them converting. That is what pushed the cost per new customer up. New customer volume fell too, down 14% on the week and down about 18% across the last three weeks.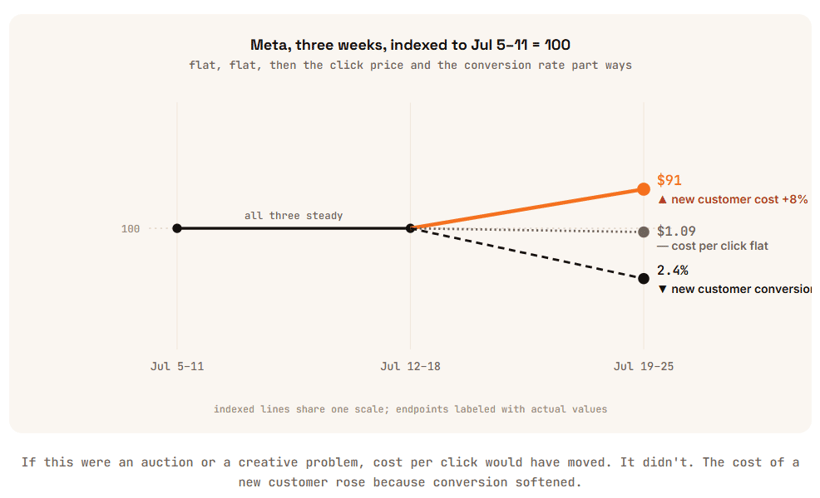
Now the important part, and the reason this is a benchmark and not just your dashboard. A drop from 2.7% to 2.4% inside your own account is impossible to read. It could be your creative, your landing page, your offer, or nothing you did at all. You cannot tell from the inside. But when the same softening shows up across hundreds of accounts in the same week, with click prices flat, the most likely explanation is not that everyone's creative fatigued on the same Monday. It is late July. Demand softens, browsers convert a little worse, and the cost of a new customer drifts up for a few weeks. This reads as a market tide, not an account failure.
Notice what would have hidden this. Meta's blended ROAS held at 0.52, exactly where it has sat all month. If ROAS were your only gauge, this week looks identical to the last two and you would see nothing to explain. The move only shows up when you watch verified new customer cost and the pieces underneath it, the click price and the conversion rate, separately.
03 / New Customer Acquisition
The full acquisition picture, by channel
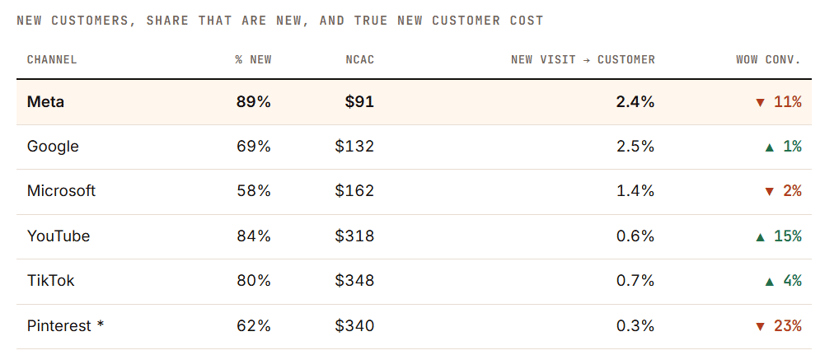
Meta is still the cheapest new customer in the set at $91 and still 89% new, so it has not stopped being the prospecting engine. It just got a little harder to run this week. Google was flat, its conversion up a single point. YouTube's conversion rose 15% but off a small base, so read it as a wobble, not a trend. Pinterest ran on very few new customers and carries an asterisk, so it anchors nothing.
04 / First Click vs Last Click
Who starts the sale vs who takes the bow
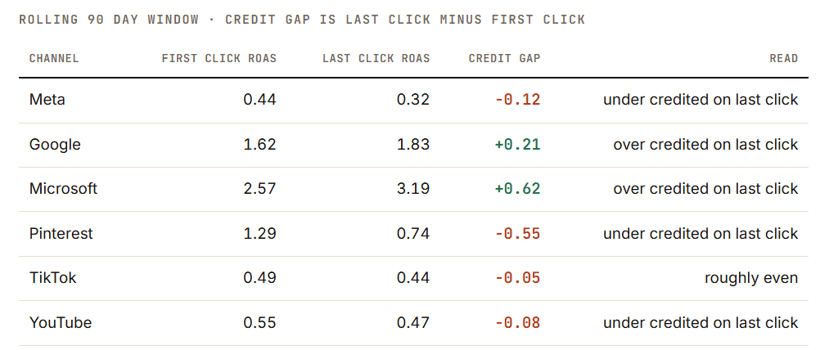
No surprises here, and that is expected from a rolling 90 day window. Last click still hands credit to the channels that close, Google and Microsoft, and still shorts Meta, the channel that opens. Worth noting only because it frames this week's Meta story: the channel already gets under credited on the way sales are reported, so a soft conversion week makes an easy target look even easier to cut. Resist that.
05 / Overall Channel Performance
Where the money goes, and THE TRUE COST OF A NEW CUSTOMER 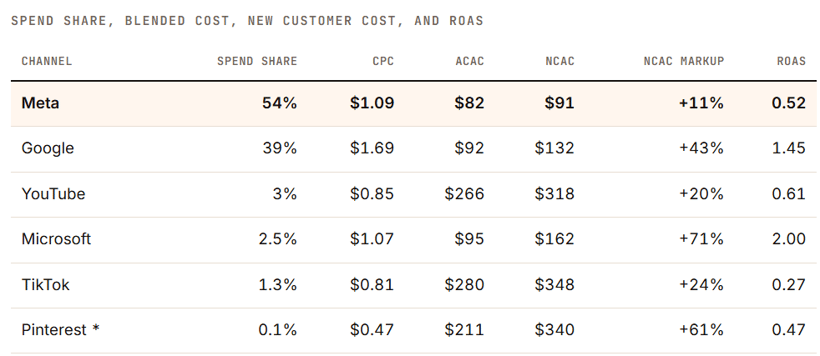
Meta and Google are again about 93% of tracked spend. Meta's aCAC and nCAC both stepped up together while the markup between them held at 11%, which is another sign this was demand softening rather than a shift in who Meta is bringing in. One quiet item worth a bookmark: Microsoft's ROAS has now slid three weeks running, 2.60 to 2.32 to 2.00. Still the highest ROAS on the board, but the direction is worth watching if it continues.
06 / New Customer Lifetime Value
What a new customer becomes over a year
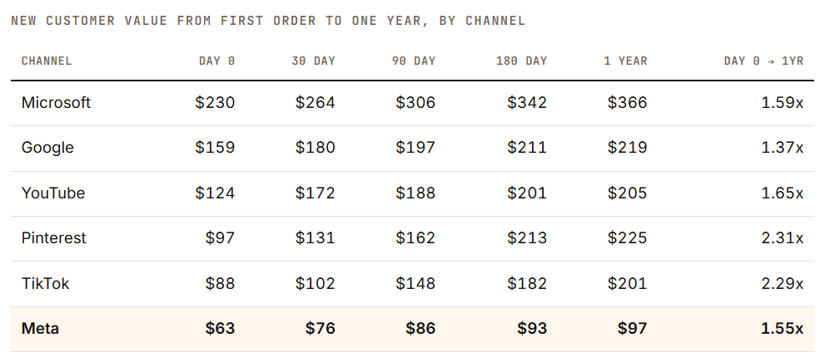
The value grid barely moved, which matters for reading the Meta story correctly. Meta's one year value held at $97. So the customers Meta acquired this week are worth about what they were worth last week. The change was in how many converted and at what cost, not in who they turn out to be. Microsoft still tops the set at $366. As always, this blends hundreds of brands at different price points, so treat it as a directional benchmark, not a promise for your store.
07 / Conclusion
Knowing it is the market is the whole point
A quiet week with one moving number is a good test of whether your measurement is worth anything. If all you had was blended ROAS, this week was invisible. If all you had was your own account, an 8% rise in new customer cost looks like a fire drill. Neither would tell you the truth, which is that clicks cost the same, conversion softened for a few weeks across the whole market, and the customers are still worth what they were.
That is the difference between panic cutting a channel in late July and holding your nerve because you can see it is the tide, not your boat. You get there with verified new customer cost and the pieces underneath it, not a single blended number that hides the whole thing.
How this week's numbers were built. Aggregated across hundreds of Wicked Reports client accounts for the week of July 19 to July 25, 2026, except first click vs last click, which uses a rolling 90 day window. New versus repeat is verified at the order level against first party order IDs, not modeled and not surveyed. The new visit to new customer conversion rate credits the channel that originated the new visit. Channels without cost data, including email, SMS, organic, and influencer, are left out of the cost comparisons. Snapchat is excluded for negligible spend. Pinterest is marked with an asterisk because it ran on a small number of new customers this week, so it is not used to anchor any headline. The channel labeled Facebook in the underlying platform data is shown here as Meta. Charts and tables carry meaning through direction, labels, and contrast rather than color alone.