

10 min read
The Paid Traffic Truth : Your best ROAS channel costs the most per new customer
.png)
The Paid Traffic Truth — Issue 003
Published July 13, 2026 · Data for the week of July 5 to July 11, 2026 · Aggregated across hundreds of Wicked Reports accounts
Rank your paid channels by ROAS and you get one order. Rank them by what a new customer actually costs and the order nearly flips. Google's ROAS is three times Meta's this week, and a new customer still costs 39% more on Google. If you move budget on ROAS alone, you are buying your most expensive customers on purpose.
This week's number
Google's blended ROAS is 3x Meta's. A new customer costs $117 on Google and $84 on Meta. The channel that looks most efficient is the priciest place to buy a customer.
01 / Introduction
One story, then the four grids
Welcome to the third edition of the Paid Traffic Truth. Every week I take one story from the world of paid traffic and break it down in the Analysis section, then hand you all four grids underneath it. New customer acquisition, first click vs last click, overall channel performance, and new customer lifetime value.
Every number comes from Wicked Reports first party new customer attribution and LTV, aggregated across hundreds of ecommerce brands and verified against real orders. These are the new customer numbers your ad platforms do not show you.
This week's featured story is the one that quietly reshuffles budgets every month. ROAS versus the true cost of a new customer.
02 / Analysis
ROAS ranks your channels backwards
Here is the trap. You open your dashboard, you sort by ROAS, and you make a decision. Microsoft is at 2.60. Google is at 1.59. Meta is sitting at 0.52 and looks like a problem. The obvious move is to pull from Meta and feed the winners.
Now sort the exact same channels by nCAC, the cost to acquire a brand new customer, verified against first order IDs. Meta is the cheapest in the set at $84. Google is $117. Microsoft is $141. The order you just trusted has flipped on its head.
So which sort is right. Both, and that is the point. ROAS is not lying to you. It is doing something worse. It is folding two very different numbers into one and hiding both.
Look at what ROAS is actually made of. Google closes a lot of demand that other channels created, so it books high revenue against its spend and posts a strong ROAS. Meta introduces people who have never heard of the brand, many of whom buy something small first, so it posts a low ROAS even while it is doing the hardest and most valuable job in the funnel, finding new humans.
The two numbers that ROAS smears together are cost and value. Split them apart and the fog clears. Cost is nCAC, what you pay to acquire a new customer. Value is nLTV, what that new customer becomes over the next year. This week Meta is the cheapest to acquire at $84 but the lowest one year value at $97. Microsoft is the most expensive to acquire at $141 but the highest one year value at $341. Neither of those facts survives inside a single ROAS number.
One honest note, because this report only works if the numbers are trustworthy. This is the week after the July 4 selling season, so conversion softened a little across most paid channels, the normal post holiday give back. But the story this week is not a calendar story. It is structural. Search and Microsoft close demand and read high on ROAS. Social and video prospect and read low. That pattern does not need a holiday to show up, and it will look the same next week. That is exactly why you cannot budget on ROAS alone.
03 / New Customer Acquisition
The full acquisition picture, by channel
Meta is carrying the prospecting load. It brought in more than 40,000 new customers this week, and89%of the customers it touched were brand new to the brand. That is the profile of a channel finding people, not milking a list. It is also the channel your dashboard told you to cut.
Conversion softened for most channels this week, the expected step down after the holiday selling week. YouTube was the exception, up 11%. Pinterest ran on a tiny base this week and is marked with an asterisk, so I am not using it to anchor anything.
04 / First Click vs Last Click
Who starts the sale vs who takes the bow
This grid is the mechanism behind the ROAS trap. Last click is the model closest to what the platforms report, and it inflates Google and Microsoft, the channels that close, while it shrinks Meta and Pinterest, the channels that open. Meta gives back 0.14 of ROAS on the last click. Microsoft gains 0.61. Judge a discovery channel on last click alone and you cut the thing that started the sale, then wonder why new customer growth stalled.
05 / Overall Channel Performance
Where the money goes, and THE TRUE COST OF A NEW CUSTOMER
Meta and Google are about 94% of tracked spend, so this is where the real decisions live. Put the ROAS column next to the nCAC column and read them together. Google's ROAS is roughly three times Meta's, and a new customer costs 39% more on Google. Microsoft posts the best ROAS in the set and the biggest gap between its blended and new customer cost, a 64% markup you never see if you only watch ROAS.
There is a second thing hiding in the aCAC column. On every paid channel the true new customer cost sits above the blended number, because blended quietly includes your existing customers coming back. It is widest exactly where ROAS looks best. That is not a coincidence. The channels that look most efficient are the ones leaning hardest on demand someone else created.
06 / New Customer Lifetime Value
What a new customer becomes over a year
This is the grid that finishes the story. Meta is the cheapest new customer to acquire and the lowest one year value at $97, a low order value high frequency profile. Microsoft is the most expensive to acquire and the highest one year value at $341. TikTok is expensive on day one but more than doubles its value by the one year mark, the strongest growth curve in the set.
Now the ROAS number makes sense, and it also makes clear why you should not trust it. Microsoft's strong ROAS is really a story about high value customers who close fast. Meta's weak ROAS is really a story about cheap acquisition of lower value customers who need time. Those are two completely different decisions, and ROAS gives you one blurry number for both. One caveat. This blends hundreds of brands at different price points, so read it as a directional market benchmark, not a promise for your store.
07 / Conclusion
Split the number, then decide
ROAS is not a business metric. It is an efficiency metric for a single platform, and it hides the two things you actually need to run acquisition, the cost of a new customer and the value of that customer over time. The channel that looks best on ROAS was the most expensive place to buy a customer this week. If you had moved budget on ROAS alone, you would have paid more to grow slower.
The fix is not a better dashboard. It is two verified numbers next to each other. What did a new customer cost, and what will that new customer become. Get those and the budget decision stops being a guess.
How this week's numbers were built. Aggregated across hundreds of Wicked Reports client accounts for the week of June 29 to July 5, 2026, except first click vs last click, which uses a rolling 90 day window. New versus repeat is verified at the order level against first party order IDs, not modeled and not surveyed. The new visit to new customer conversion rate credits the channel that originated the new visit. Channels without cost data, including email, SMS, organic, and influencer, are left out of the cost comparisons. Snapchat is excluded for negligible spend. Pinterest is marked with an asterisk because it ran on a small number of new customers this week, so it is not used to anchor any headline. The channel labeled Facebook in the underlying platform data is shown here as Meta. Charts and tables carry meaning through direction, labels, and contrast rather than color alone.
Topics: Wicked Reports customer lifetime value Google Ads Marketing Attribution New Customer Acquisition Cost (NCAC) Meta Ads paid traffic blended ROAS first click vs last click Paid Traffic Truth
8 min read
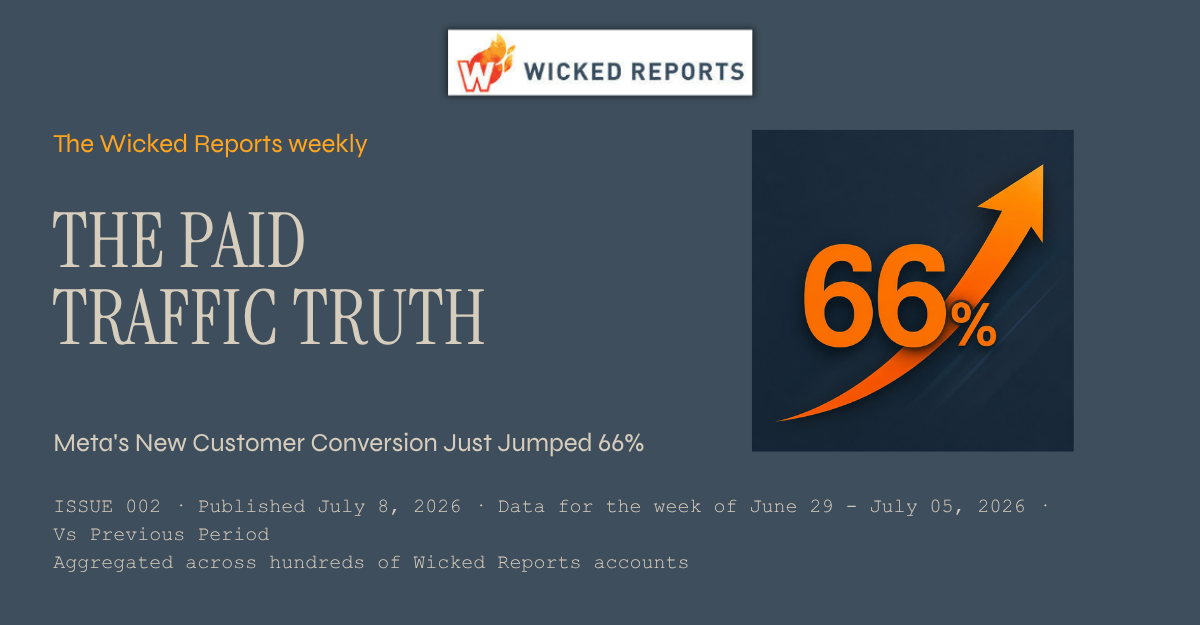
The Paid Traffic Truth : Meta's New Customer Conversion Just Jumped 66%
The Paid Traffic Truth — Issue 002
Published July 6, 2026 · Data for the week of June 29 to July 5, 2026 · Aggregated across hundreds of Wicked Reports accounts
In one week, Meta's new visit to new customer conversion rate rose 66%, its nCAC fell 38% to $81, and it drove 68% more new customers. This is the kind of move blended dashboards miss, and the reason this report exists.
This week's number
Meta's new visit to new customer conversion rate jumped 66% week over week, while its nCAC fell 38% to $81.
01 / INTRODUCTION
Welcome to the second edition of the Paid Traffic Truth. Every week I take one story from the world of paid traffic and break it down in the Analysis section, then hand you all four grids underneath it - new customer acquisition, first click vs last click, overall channel performance and new customer lifetime value. Every number comes from Wicked Reports first party new customer attribution and LTV, aggregated across hundreds of ecommerce brands and verified against real orders. These are the new customer numbers your ad platforms do not show you.
This week's featured story is the new visit to new customer conversion rate, and Meta owns it.
02 /Analysis
Meta turned more cold traffic into customers
First, what the metric means. A new visit is a page load from someone who has never been to your site before, ever. The new visit to new customer conversion rate is the share of those new visitors who go on to become first time customers.
Here is the part platforms get wrong and Wicked gets right. Wicked credits the channel that first brought the visitor in, even when the purchase happens later on a different channel. If your Meta ad drives a new visit and that person converts a week later through Google branded search, Meta still gets the conversion credit, because Meta found the new visitor who started the path.
Meta's new visit to new customer conversion rate improved 66% week over week, its nCAC dropped 38% to $81, and it brought in 68% more new customers than the week before. Conversion up, cost down, volume up, all at once, on the channel carrying the majority of tracked spend. TikTok moved the same direction at a smaller scale, up 33%, while YouTube slipped 19%.
One honest note, because this report only works if the numbers are trustworthy. This week contained the July 4th selling season, which pulls hesitant new visitors over the line across the whole market and the weekly figure counts same week orders, so a promo period naturally lifts conversion and lowers cost. Meta was also coming off a rough June. The fair read is a real rebound, helped by the holiday calendar. Either way, the movement is exactly the kind of signal a blended dashboard buries.
03 / New Customer Acquisition
The full acquisition picture, by channel
Meta's row tells the story, but notice the shape of the others. TikTok converted more new visits too. Google held flat on a huge base. YouTube gave some back. Direction matters more than any single week and this week the direction on new customer conversion was up for the channels that do the prospecting.
04 / First Click vs Last Click
Who starts the sale vs who takes the bow
The pattern barely moves week to week, which is the point. Microsoft and Google look strongest on the last click because they close, but the prospecting channels that introduce customers - Meta, Pinterest, TikTok, YouTube - all read higher on the first click. Judge a discovery channel on last click alone and you cut the thing that started the sale.
Meta and Google are about 93% of tracked spend. Look at the two cost columns side by side. On every channel the true new customer cost sits above the blended aCAC and it is widest on the search channels that look cheapest, Google at $69 blended against $105 for a new customer. Meta's blended cost fell 37% this week, which lines up with the strong new customer week in the Analysis.
06 / New Customer Lifetime Value
What a new customer becomes over a year
Microsoft and Google produce the most valuable new customers over a year, $337 and $212. Meta is cheap to acquire but the lowest one year value in the set at $97, a low AOV high frequency profile. TikTok roughly doubles a customer's value from first order to the one year mark. One caveat. This blends hundreds of brands at different price points, so read it as a directional benchmark for the market, not a promise for your store.
07 / Conclusion
Measure new versus repeat, then decide
Meta had a genuinely strong new customer week, and a blended dashboard would have shown you almost none of it. That is the whole reason for this report. Every week, verified new customer numbers across every channel, so you can see what is actually working before you move budget.
See your own VERSION OF THESE four grids
Your real nCAC next to your aCAC, your first versus last click gap, your new customer LTV by channel, in your own account.
How this week's numbers were built. Aggregated across hundreds of Wicked Reports client accounts for the week of June 29 to July 5, 2026, except first click vs last click, which uses a rolling 90 day window. New versus repeat is verified at the order level against first party order IDs, not modeled and not surveyed. The new visit to new customer conversion rate credits the channel that originated the new visit. Channels without cost data, including email, SMS, organic, and influencer, are left out of the cost comparisons. Snapchat is excluded for negligible spend. Pinterest is marked with an asterisk because it ran on a small number of new customers this week, so it is not used to anchor any headline. The channel labeled Facebook in the underlying platform data is shown here as Meta. Charts and tables carry meaning through direction, labels, and contrast rather than color alone.