

10 min read
The Paid Traffic Truth : Why YouTube's New Customer Cost Just Reset
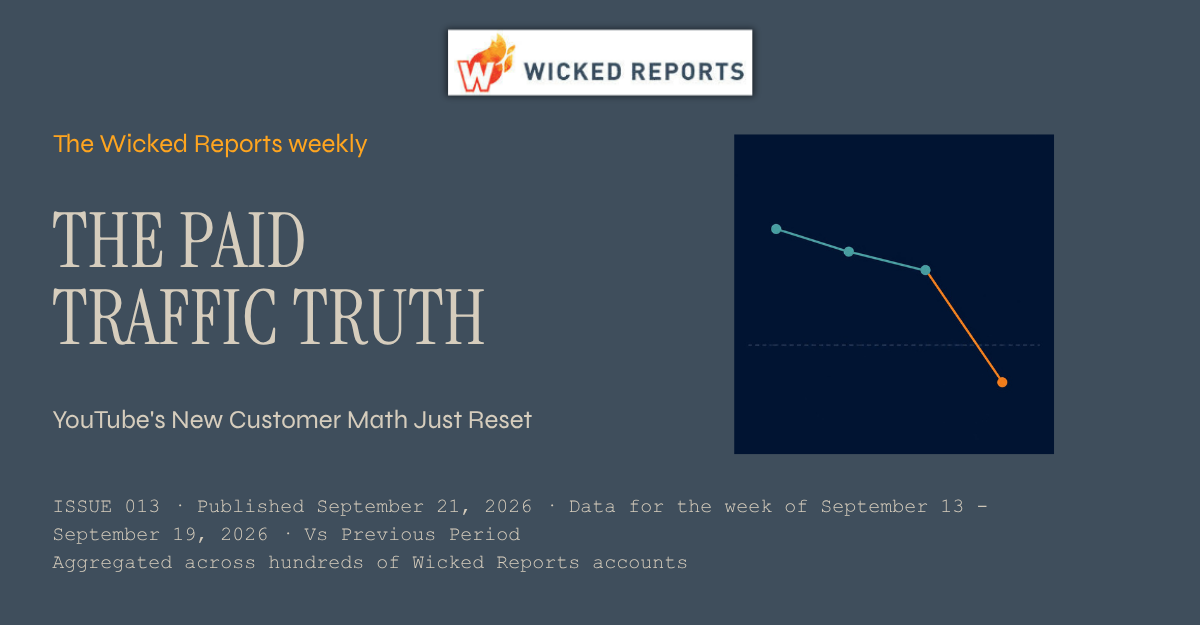
The Paid Traffic Truth — Issue 013
Published September 21,2026 * Data for the week of September 13 to September 19 2026 * Aggregated across hundreds of Wicked Reports accounts.
YouTube's New Customer Math Just Reset
Everyone spent September watching Meta and Google trade holiday effects. Meanwhile the biggest verified move of the week happened on the channel most brands wrote off as unmeasurable. YouTube's cost of a new customer fell by nearly half, and the give-back from the holiday only explains part of it.
This week's number
YouTube's verified nCAC fell 43% in one week, from $629 to $360, while new visit to customer conversion rose 54% and its new-customer share jumped from 56% to 79%.
01 / Introduction
First, the receipt. Then the actual news.
Last issue ended with a prediction: the Labor Day effect would give something back, and I would report it either way. Here is the scorecard. Search snapped back on cue, with Google's nCAC down 4% to $172 and conversion up on both Google and Microsoft. Meta, meanwhile, never gave anything back. Third straight week of falling new customer cost, now at $78. The full grids are below.
But the real story of the week is not the two channels everyone watches. It is the one most brands quietly gave up on measuring. This issue tells that story, then walks the same four verified grids as always: new customer acquisition, first click versus last click, overall channel performance, and new customer lifetime value. All first-party, order-verified, aggregated across hundreds of Wicked Reports accounts. No modeling, no surveys.
02 / Analysis
Video's quiet reset, and how much of it is real
Three YouTube numbers moved together this week, and the combination matters more than any one of them. Verified nCAC fell 43% to $360. New visit to customer conversion rose 54%. And the share of YouTube's tracked customers who are genuinely new jumped from 56% to 79%, which pulled its markup over blended CAC down from 79% to 25%. Click prices were flat. This was not YouTube getting cheaper to click. It was YouTube traffic converting better and skewing much harder toward first-time buyers.
Why does this matter beyond one channel's good week? Because YouTube is the channel where the measurement excuse runs deepest. Views happen on a TV screen, the click comes days later from a phone, last-click reporting hands the sale to search, and the line item gets cut. This week, verified at the order level, that supposedly unmeasurable channel bought a new customer for $360 while carrying the second-highest new-customer share of any paid channel at 79%, behind only Meta's 91%. Video is prospecting almost by definition, and this week the prospecting got dramatically more efficient.
The honest note, and this one needs to be firm. This is one week of data on a channel carrying 4.3% of tracked spend, so a smaller pool of accounts can move the aggregate more than it could on Meta or Google. Part of the drop is plain post-holiday normalization, because YouTube's cost inflated through the holiday weeks. But the give-back defense only stretches so far: a return to normal would land YouTube back in its pre-holiday range, and $360 is far below it, with the new-customer mix shift pointing the same direction. I am calling this a watch-list item, not a scale signal. If nCAC holds under roughly $450 next week with the new share staying near 80%, it starts to look structural. One week is never a budget decision.
03 / New Customer Acquisition
The full acquisition picture, by channel
Beyond the YouTube row, note the search recovery I promised to report: Google and Microsoft conversion both climbed as the holiday effect unwound, exactly the snap-back Issue 011 predicted. TikTok swung violently the other way, conversion up 329% and nCAC down 80% to $227, but it whipsawed just as hard downward the week before, so I treat its week-to-week reads as noise until it strings a few together. Meta keeps grinding cheaper, a story we are now watching closely into Q4.
04 / First Click vs Last Click
Who starts the sale vs who takes the bow
The YouTube row here is the reason this week's reset went unnoticed on most dashboards. Video is under-credited on last click, so the platforms handing out credit gave a piece of YouTube's improvement to the search box that closed the journey. If your reporting runs on last click, your YouTube got cheaper this week and your dashboard told you Google did it.
05 / Overall Channel Performance
Where the money goes, and THE TRUE COST OF A NEW CUSTOMER
Look at YouTube's markup column against the search channels. A week ago video carried a 79% penalty between blended CAC and true new customer cost. This week it is 25%, tighter than Google's 58% and Microsoft's 70%. Search still posts the pretty ROAS numbers, and search is still where blended CAC most flatters the real cost of growth. The standing lesson of this grid does not change: the channels that look most efficient on ROAS are the ones borrowing most heavily from demand that already existed.
06 / New Customer Lifetime Value
What a new customer becomes over a year
This grid is what turns YouTube's cheap week into a real economics question. A YouTube customer starts at $79 and nearly triples inside 30 days to $233, the steepest early payback curve of any paid channel, reaching $261 at one year. Judged on day-zero math, a $360 nCAC against a $79 first order looks indefensible. Judged on the 30-day number, the gap nearly closes on click-credited revenue alone, before any view-through contribution. The standing caveat applies: this grid blends brands at very different price points, so it is a directional market benchmark, not a promise for any one store.
07 / Conclusion
Put video on the watch list, with a number attached
The September story so far: the holiday came and went, search snapped back, Meta keeps getting quietly cheaper, and now video just posted the biggest verified efficiency move of the month while most dashboards handed the credit to the search box. None of that is visible on last click, and none of it is visible on ROAS.
The move this week is specific. Pull your own YouTube new customer cost, verified against orders, not platform-reported. Write down this week's number and the new-customer share next to it. If both hold through next week, you have an early position on a channel most of your competitors stopped measuring years ago. That is the entire advantage: not spending more, just knowing sooner. I will publish what the aggregate did either way.
See your own version of these four grids.
Your real nCAC next to your aCAC, your first versus last click gap, your new customer LTV by channel, in your own account.
Get the Paid Traffic Truth Report directly to your inbox.
How this week's numbers were built. Aggregated across hundreds of Wicked Reports client accounts for the week of September 13 to September 19, 2026, except first click vs last click, which uses a rolling 90 day window. New versus repeat is verified at the order level against first party order IDs, not modeled and not surveyed. The new visit to new customer conversion rate credits the channel that originated the new visit. Channels without cost data, including email, SMS, organic, and influencer, are left out of the cost comparisons. Snapchat is excluded for negligible spend. Pinterest is marked with an asterisk because it ran on a small number of new customers this week, so it is not used to anchor any headline. The channel labeled Facebook in the underlying platform data is shown here as Meta. Charts and tables carry meaning through direction, labels, and contrast rather than color alone.
Topics: Wicked Reports New Customer Acquisition Cost (NCAC) Paid Traffic Truth YouTube Ads Video Prospecting First Click vs Last Click Attribution
9 min read
The Paid Traffic Truth : The 159% Markup Hiding Inside Your Blended CAC
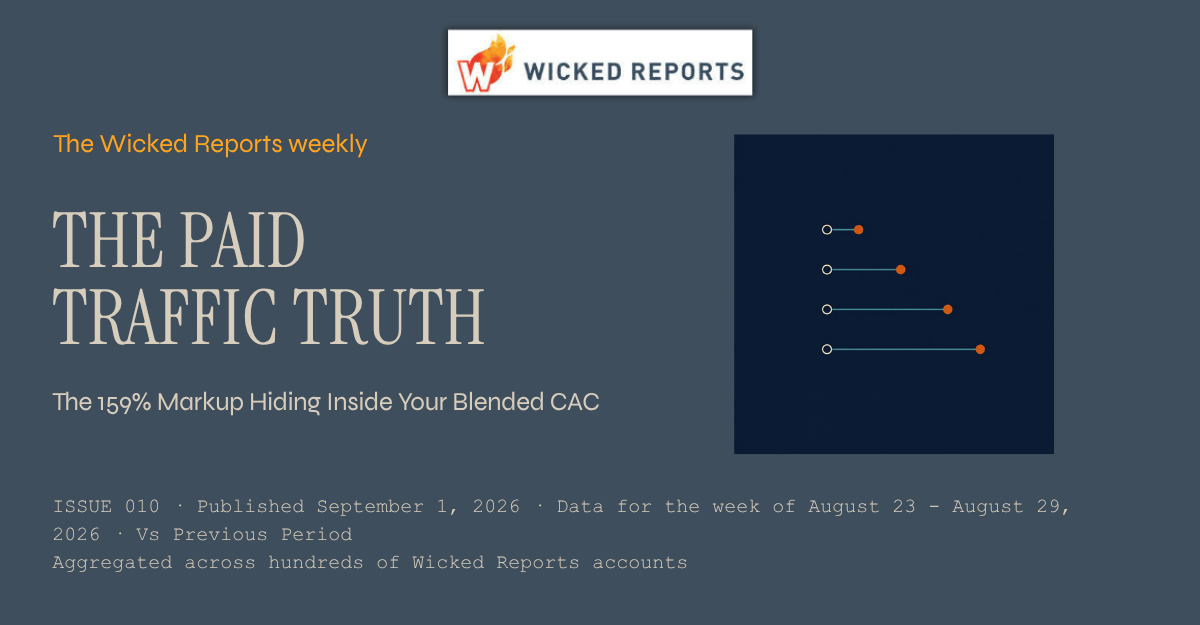
The Paid Traffic Truth — Issue 010
Published September 1,2026 * Data for the week of August 23 to August 29 2026 * Aggregated across hundreds of Wicked Reports accounts.
The 159% Markup Hiding Inside Your Blended CAC
Back in Issue 001 I showed you that the CAC on your dashboard is not the cost of a new customer. It is the cost of any customer, with cheap repeat buyers averaged in. Nine weeks later the pattern has not budged. This week the gap between the two numbers runs from 14% on Meta to 159% on YouTube, and if you budget off the blended number, you are paying for growth you are not getting.
This week's number
YouTube's blended CAC reads $319. A verified first-time customer costs $826. That 159% markup never shows up on a platform dashboard.
01 / Introduction
The two CACs, revisited
Every week we aggregate first-party, order-verified data across hundreds of eCommerce accounts and publish the four grids: new customer acquisition, first click versus last click, overall channel performance, and new customer lifetime value. One story per issue. This week the story is the markup between aCAC, the blended cost of acquiring any customer, and nCAC, the cost of acquiring a customer who has never bought from you before.
We ran this comparison in our very first issue. I am running it again on purpose, because the honest news is persistence. This is not a weekly anomaly you can wait out. It is a structural property of how blended CAC is calculated, and the size of the distortion depends entirely on which channel you are looking at.
02 / Analysis
Every channel marks up its blended CAC. Not equally.
The mechanism is simple. Blended CAC divides spend by all customers acquired, new and repeat alike. Repeat buyers convert cheaply because they already know you, so every repeat purchase mixed into the denominator pulls the average down. The more a channel leans on people who have already bought, the more flattering its blended CAC looks, and the bigger the surprise when you isolate true new customers.
Look at the shape of that chart. Meta's line is barely visible, a 14% markup, because 87% of Meta's tracked buyers this week were genuinely new. Meta's blended number and its new customer number are nearly the same number. Google marks up 51% at 66% new. Microsoft marks up 67% at 60% new. Then there is YouTube, where only 39% of buyers were new, and the markup explodes to 159%. The rule holds across the whole grid: the lower a channel's share of new buyers, the bigger the lie in its blended CAC.
One honest note on this week's magnitude. The markup pattern itself is structural. It comes from arithmetic and channel mix, not from the calendar, and it will look similar next week and the week after. But YouTube's specific 159% figure is elevated this week because YouTube's new visit to customer conversion dropped sharply week over week, which pushed its nCAC up hard while blended CAC moved less. Late August is a quiet stretch with no holiday selling event to blame, so read the direction as permanent and this week's YouTube extreme as the high end of its normal range. And because this data blends hundreds of accounts, no single brand's promotion can move these aggregates.
03 / New Customer Acquisition
The full acquisition picture, by channel
Meta keeps its spot as the volume engine, and at 87% new it is doing the job most brands assume all their paid channels are doing: bringing in people who have never bought. Google converts steadily at a defensible $154 nCAC. The row to sit with is YouTube. Only 39% of its buyers were new, its conversion rate fell by half week over week, and its nCAC landed at $826. If your dashboard shows YouTube at its blended $319, you are looking at a number that is mostly repeat purchase behavior wearing a prospecting costume.
04 / First Click vs Last Click
Who starts the sale vs who takes the bow
Same pattern as always: the social and video channels that open relationships get shortchanged by last click, and the search channels that close them get inflated. Notice this cuts the opposite way from the markup story. Last click makes YouTube look slightly worse than it is on revenue credit, while blended CAC makes it look wildly better than it is on new customer cost. Two different distortions, one channel, and neither one visible if you only run one report.
05 / Overall Channel Performance
Where the money goes, and THE TRUE COST OF A NEW CUSTOMER
Read the markup column top to bottom. Every single paid channel costs more per new customer than its blended CAC admits. There is no channel where the blended number is honest. The only question is how big the markup is, and the answer ranges from a rounding error on Meta to more than double on YouTube. If your growth model uses one CAC for the whole business, your model is built on the most flattering version of every channel simultaneously.
06 / New Customer Lifetime Value
What a new customer becomes over a year
Here is the fairness clause for YouTube. Its new customers start small at $84 and nearly triple to $244 by one year, still the steepest growth curve in the set, a pattern we covered in depth in Issue 008. That back-end value is real, but it does not erase an $826 nCAC. It means YouTube is a channel you evaluate on a payback window, not on week-one math, and definitely not on blended CAC. One caveat that applies to this whole grid: it blends brands at very different price points, so treat it as a directional market benchmark, not a promise for your store.
07 / Conclusion
One business, two CACs. Budget off the right one.
The blended CAC on your dashboard is answering a question you did not ask. You want to know what growth costs. It is telling you what activity costs, with your cheapest, most loyal buyers averaged in to make every channel look better than it is. Nine issues into this series, the markup between the two numbers has shown up every single week, on every paid channel, without exception.
The fix is not more reporting. It is verifying new versus repeat at the order level, pricing each channel by its true nCAC, and then making Scale, Chill, or Kill decisions off that number. Meta at a $88 nCAC and 87% new is a different decision than YouTube at $826 and 39% new, even though blended CAC says they are $77 and $319. Know which number you are looking at before you move the budget.
How this week's numbers were built. Aggregated across hundreds of Wicked Reports client accounts for the week of August 23 to August 29, 2026, except first click vs last click, which uses a rolling 90 day window. New versus repeat is verified at the order level against first party order IDs, not modeled and not surveyed. The new visit to new customer conversion rate credits the channel that originated the new visit. Channels without cost data, including email, SMS, organic, and influencer, are left out of the cost comparisons. Snapchat is excluded for negligible spend. Pinterest is marked with an asterisk because it ran on a small number of new customers this week, so it is not used to anchor any headline. The channel labeled Facebook in the underlying platform data is shown here as Meta. Charts and tables carry meaning through direction, labels, and contrast rather than color alone.
Topics: Wicked Reports New Customer Acquisition Cost (NCAC) Paid Traffic Truth YouTube Ads CAC Markup Blended CAC
9 min read
The Paid Traffic Truth : Why Your Priciest Ad Channel Grows the Fastest Customers
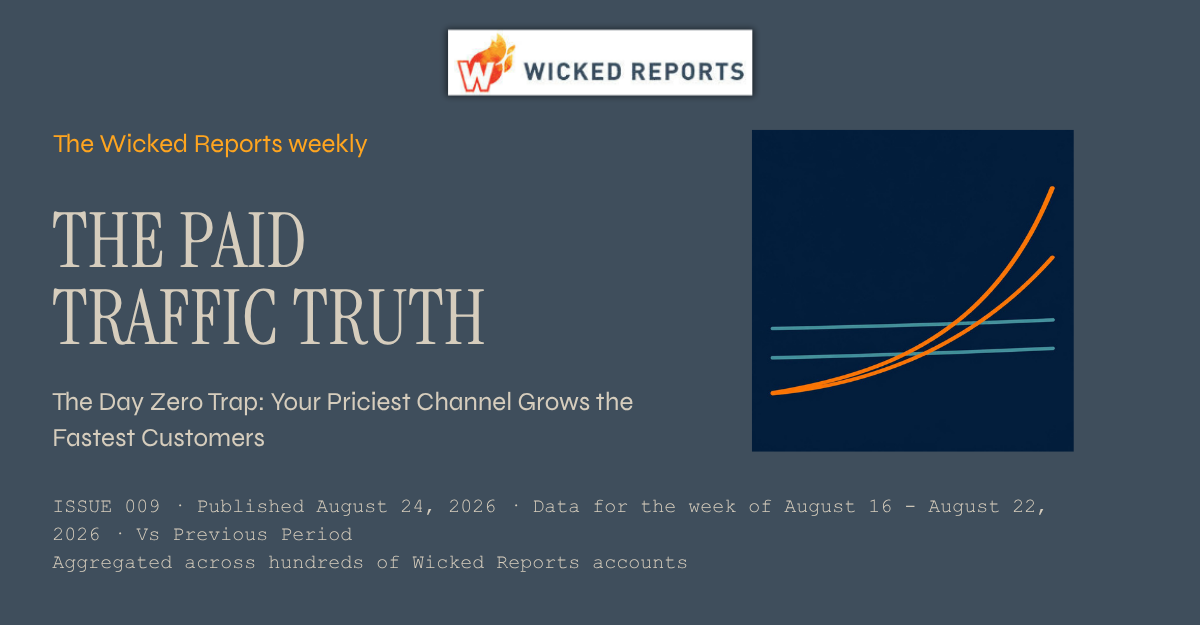
The Paid Traffic Truth — Issue 009
Published August 24,2026 * Data for the week of August 16 to August 22 2026 * Aggregated across hundreds of Wicked Reports accounts.
The Day Zero Trap: Your Priciest Channel Grows the Fastest Customers
Most operators judge a channel on what a customer spends the day they arrive. This week's data shows why that math quietly kills your fastest compounding channels. The customers who look worst on day zero are growing in value twice as fast as the ones who look best.
This week's number
A YouTube new customer nearly doubles in value in 30 days: $104 at first order, $199 by day 30, $235 at one year. Judge it on day zero and you miss more than half the value.
01 / Introduction
One story, four grids, hundreds of verified accounts
Every week I aggregate first party, order verified data across hundreds of eCommerce accounts and publish what the ad platforms will not show you. One story leads, and the same four grids follow: new customer acquisition, first click versus last click, overall channel performance, and new customer lifetime value. No modeled conversions, no surveys, no platform grading its own homework.
This week's story lives in the lifetime value grid. YouTube posts the ugliest new customer cost of any major paid channel, and it also grows the most valuable customer curve of any major paid channel. Both things are true at once, and if your measurement stops at day zero, you only ever see the first one.
02 / Analysis
Day zero revenue understates video customers by more than 2x
Here is the setup. A Meta new customer spends $64 on their first order. A YouTube new customer spends $104. On day zero, both look thin against their acquisition costs, and YouTube looks worst of all at a $478 nCAC. So the standard move is to kill the video spend and pour it back into whatever converts cheapest today. Now watch what happens after day zero.
A YouTube customer goes from $104 to $199 in 30 days. That is a 91% jump in one month, the steepest early payback curve of any channel with meaningful spend. By one year they are worth $235, a 2.26x multiple on their first order. TikTok shows the same shape at 2.29x. Meanwhile Meta, the cheap channel everyone trusts, grows its $64 first order to just $99, a 1.56x multiple, and Google manages only 1.36x. The channels that look worst on day zero compound the fastest. And to be clear about what the data does not say: even at one year, click credited revenue alone does not cover YouTube's $478 nCAC. That is the second half of the trap. The first versus last click grid below shows YouTube is under credited on last click, and none of these click based numbers count view driven purchases at all. Day zero math understates the customer by half, and click only credit understates the channel on top of it. Stack those two errors and killing video looks like discipline when it is actually a blind spot.
The honest read on this week: this is a structural pattern, not a calendar artifact. Video first channels acquire customers with lighter first orders that compound, and the shape holds across YouTube and TikTok in the same grid, in a plain late August week with no holiday selling event to distort it. Because this is aggregated across hundreds of accounts, no single brand's promotion can move these curves. What did move this week for calendar reasons is conversion rate, which dipped across most channels in typical late summer fashion. The LTV grid is built on a full year of cohort behavior, so the weekly dip does not touch the story.
03 / New Customer Acquisition
The full acquisition picture, by channel
Notice the pattern in the % new column. The expensive video channels bring in the freshest buyers: 79% of YouTube's customers and 81% of TikTok's are first timers, versus 65% on Google and 59% on Microsoft. Video is doing prospecting work. Search is, in large part, closing demand that already exists. Conversion rates softened across most channels this week, a normal late summer move, with YouTube's new visit to customer rate down 15% week over week.
04 / First Click vs Last Click
Who starts the sale vs who takes the bow
Same story it always tells, and this week it stacks on top of the LTV story. YouTube reads 0.49 on first click but only 0.42 on last click, because it starts journeys that search and email finish. Google and Microsoft read higher on last click than first, because they take the bow at the end of journeys someone else started. If your reporting is last click and day zero, video channels get penalized twice: once for starting sales they do not get credit for closing, and once for acquiring customers whose value has not shown up yet.
05 / Overall Channel Performance
Where the money goes, and THE TRUE COST OF A NEW CUSTOMER
Meta and Google together carry 91% of tracked spend, so the market has voted for cheap day zero acquisition. Fair enough. But look at the ROAS column with fresh eyes: the best weekly ROAS in the set belongs to Microsoft at 1.89, a channel where only 59% of buyers are new and last click over credits it by 0.46. High weekly ROAS keeps correlating with closing existing demand, not creating new customers. Cheap and compounding are different things, and this grid only shows you cheap.
06 / New Customer Lifetime Value
What a new customer becomes over a year
Sorted by growth multiple, the video and social channels own the top of this grid while search sits near the bottom. A Google customer arrives spending $164 and grows only 36% in a year. A YouTube customer arrives spending $104 and more than doubles. Pinterest posts the steepest multiple at 2.65x, but it runs on very little spend and very few new customers this week, so treat it as a footnote, not a finding. One standing caveat: this grid blends brands at different price points, so it is a directional market benchmark, not a promise for any one store.
07 / Conclusion
Stop grading a compounding asset on its opening day
Every channel in your account is being judged by a number, and for most operators that number is built from day zero revenue and last click credit. This week's data shows exactly which channels that math executes: the video channels acquiring your freshest customers with the fastest growing value curves. Nobody decides to kill their best prospecting engine. They just use a measuring stick that makes killing it look responsible.
The fix is not faith in video. It is measurement that follows the customer past day zero and past the last click. Know your real nCAC by channel, know what a new customer from each channel is worth at 30, 90, and 365 days, and make Scale, Chill, and Kill calls on that, not on a screenshot of week one ROAS. The channels compound. Your measurement should too.
How this week's numbers were built. Aggregated across hundreds of Wicked Reports client accounts for the week of August 16 to August 22, 2026, except first click vs last click, which uses a rolling 90 day window. New versus repeat is verified at the order level against first party order IDs, not modeled and not surveyed. The new visit to new customer conversion rate credits the channel that originated the new visit. Channels without cost data, including email, SMS, organic, and influencer, are left out of the cost comparisons. Snapchat is excluded for negligible spend. Pinterest is marked with an asterisk because it ran on a small number of new customers this week, so it is not used to anchor any headline. The channel labeled Facebook in the underlying platform data is shown here as Meta. Charts and tables carry meaning through direction, labels, and contrast rather than color alone.
Topics: Wicked Reports first click vs last click Paid Traffic Truth YouTube Ads paid traffic attribution new customer lifetime value
6 min read
Target YouTube Ads by Search History

HOW TO TARGET HIGH-INTENT YOUTUBE AUDIENCES BY SEARCH HISTORY IN 2026 (AND PROVE WHICH ONES ACTUALLY PAY OFF)
Most YouTube advertising is a spray of impressions at people who never asked to see you. There is a sharper way. Google lets you show your video ads specifically to people who have recently searched for the things you sell, which is about the highest-intent YouTube audience you can build. But targeting the right people is only half the job. The other half, the half most advertisers skip, is proving which of those audiences actually turned into profitable customers rather than just cheap views. Here is how to do both.
Topics: Wicked Reports Marketing Attribution Custom Segments YouTube Ads Video Ad Attribution search intent targeting
6 min read
How to Track YouTube Ads & Measure Real ROI

HOW TO TRACK YOUTUBE ADS AND MEASURE REAL ROI FROM VIDEO
The oldest problem in advertising still bites hardest on YouTube. As the saying goes, half your ad budget is wasted and you just do not know which half. Video makes that worse, because a YouTube ad so often does its work early — someone watches on their phone during a commute, forgets about it, then searches your brand three days later on a laptop and buys. Last-click attribution gives YouTube zero credit for that sale. If you are judging YouTube on what Google Ads reports, you are almost certainly underrating it. Here is how to track YouTube ads properly and measure their real ROI.