The Paid Traffic Truth — Issue 012
Published September 14,2026 * Data for the week of September 06 to September 12 2026 * Aggregated across hundreds of Wicked Reports accounts.
The Holiday Kept Paying Meta and Kept Billing Google
Last week I told you the Labor Day run-up made discovery channels cheaper and search more expensive. This week contained the holiday itself, and the split did not soften. It widened. If you run both Meta and Google, the same calendar event just moved your two biggest channels in opposite directions for the second week in a row.
This week's number
Google's verified new customer cost climbed a second straight week, up 11% to $179, while Meta's fell again to $82. Same holiday. Opposite bills.
01 / Introduction
Labor Day, part two. The split held.
In Issue 011 I flagged that the Labor Day run-up was making everyone's ads look smarter than they are, with one exception : Google, the lone major channel where the cost of a new customer went up while everything else got cheaper. I also said this week's data would contain the holiday weekend itself, so we would find out whether that was noise or a pattern.
It was a pattern. This issue tells that one story, then walks the same four verified grids we publish every week: new customer acquisition, first click versus last click, overall channel performance, and new customer lifetime value. All of it is first-party, order-verified data aggregated across hundreds of Wicked Reports accounts. No modeling, no surveys.
02 / Analysis
Holiday demand is discovery demand. Two weeks of receipts.
Here is what the week of the holiday itself did to the two channels that carry 93% of tracked spend. Meta's verified nCAC fell 4% to $82, with new visit to customer conversion up 7% and click prices down 6%. Google's nCAC rose 11% to $179, with conversion down 5% and click prices barely moving. That is the second consecutive week the two lines have moved apart.
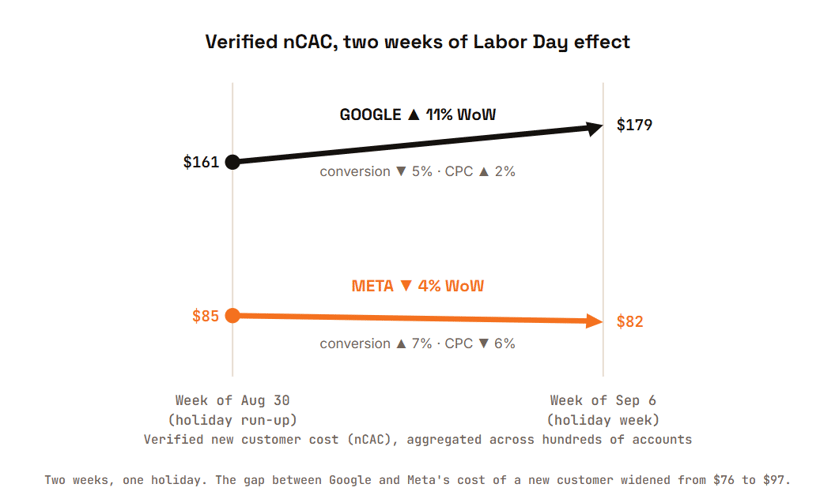
The mechanism is the one I named last week, now with confirmation. A holiday puts people in browse mode. Feeds fill with deal creative and shoppers buy things they were not searching for, which is why Meta converted better and got cheaper. Search works the opposite way. Holiday buyers who would have typed a brand name into Google got intercepted upstream by a feed ad, so search traffic skewed toward comparison shoppers and its conversion slipped. Microsoft, the other search channel in the set, told the same story louder: conversion down 13% and nCAC up 26% to $171. When both search channels move together against both discovery patterns, that is not one platform having a bad week. That is demand changing shape.
The honest note. This is still a calendar story, not a structural one. Two weeks of divergence is a holiday arc playing out exactly as a holiday arc should: the run-up week, then the holiday week itself. The structural part is the lesson, not the numbers. Holiday demand reliably flows to discovery channels and drains search, and it will do it again in November, at much larger dollar amounts. Do not read Google's $179 as its new baseline, and do not read Meta's $82 as your media buyer's genius. Next week's data should show the give-back, and I will report it either way.
03 / New Customer Acquisition
The full acquisition picture, by channel
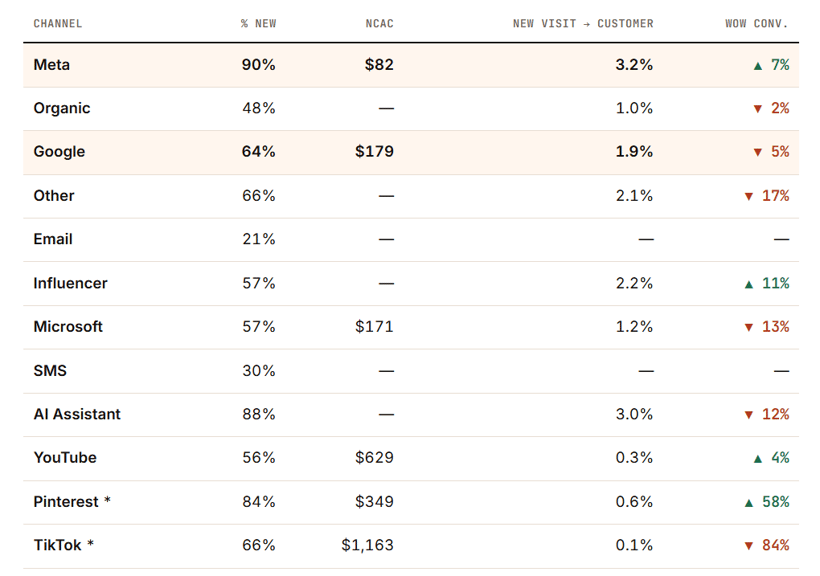
Two things beyond the headline. Meta is running 90% new customers, the highest new share of any major channel, which means its cheap acquisition really is acquisition and not repeat business dressed up. And the search-side softness was not just Google: Microsoft's conversion fell harder than anyone's. TikTok gave back its recent volume and returns to thin-data status this week, so I am not reading anything into its swing.
04 / First Click vs Last Click
Who starts the sale vs who takes the bow
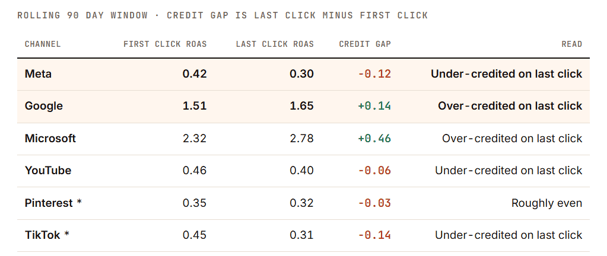
This grid explains why holiday weeks fool last-click reporting. The discovery channels that start the sale, Meta especially, are under-credited on last click, while both search channels are over-credited because they close journeys the feed started. In a week where feeds did the heavy lifting, your last-click dashboard handed even more of Meta's holiday work to Google. If you rebalanced budget off that view this week, you rewarded the closer and cut the opener.
05 / Overall Channel Performance
Where the money goes, and THE TRUE COST OF A NEW CUSTOMER 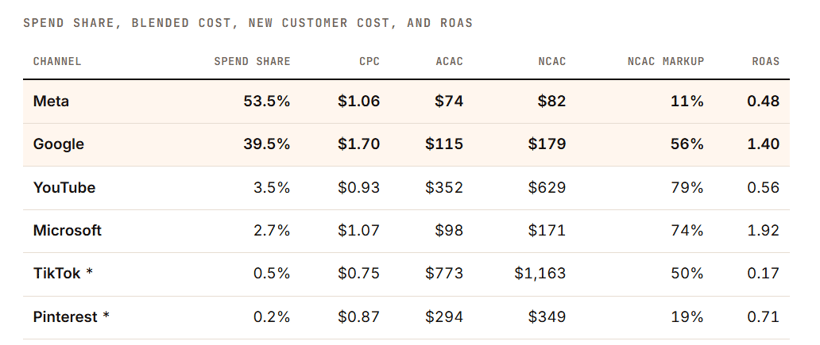
Note the standing trap in this grid. Google still posts nearly 3x Meta's ROAS, and it is still the more expensive place to buy a new customer, by 118% this week. Search ROAS is inflated by closing credit and repeat purchases; Meta's 11% markup between aCAC and nCAC says almost everything it acquires is genuinely new. If you allocate on ROAS alone, this week you would have shifted holiday budget toward the channel whose new customer cost just climbed twice.
06 / New Customer Lifetime Value
What a new customer becomes over a year
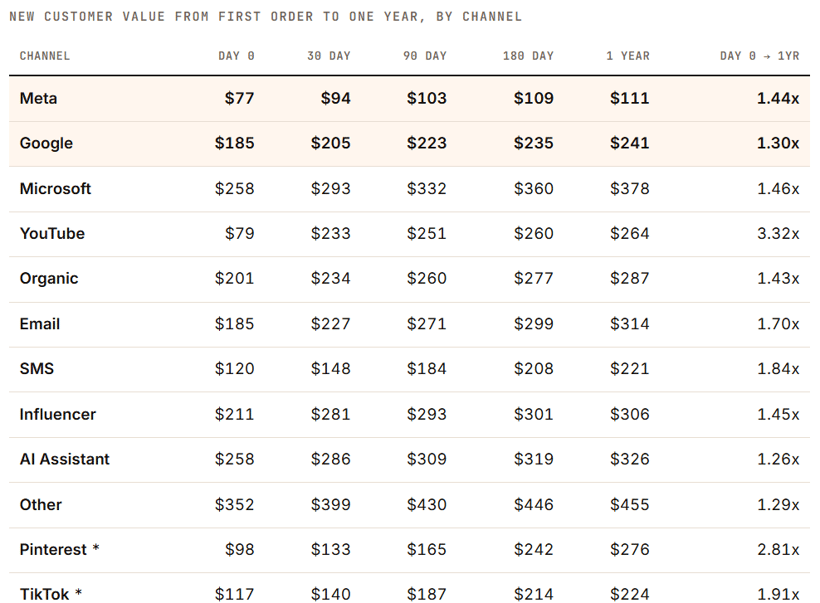
The LTV grid is why the holiday split matters beyond one week. A Google new customer is worth $241 at one year against a $179 acquisition cost, so search can absorb some holiday inflation and still pay back. A Meta customer at $111 against $82 is a thinner margin that depends on that cheap nCAC holding. One standing caveat: this grid blends brands at very different price points, so treat it as a directional market benchmark, not a promise for any one store.
07 / Conclusion
Tag both weeks, then wait for the give-back
Two weeks of Labor Day data now say the same thing. Holiday demand flows to discovery and drains search, and last-click reporting hides it by handing the feed's work to the search box. If your Meta looked brilliant and your Google looked broken these two weeks, neither is true. The calendar did both.
The move this week is bookkeeping, not budget. Tag Aug 30 through Sep 12 as holiday-affected in whatever you use to judge performance, benchmark them against past holiday windows instead of ordinary weeks, and write down what your verified nCAC did on each channel. That note is your playbook for Black Friday, when this exact pattern returns with ten times the money on the table. Next issue we find out how much of this snaps back. your own version of these four grids
See your own version of these four grids.
Your real nCAC next to your aCAC, your first versus last click gap, your new customer LTV by channel, in your own account.
Get the Paid Traffic Truth Report directly to your inbox.
How this week's numbers were built. Aggregated across hundreds of Wicked Reports client accounts for the week of September 06 to September 12, 2026, except first click vs last click, which uses a rolling 90 day window. New versus repeat is verified at the order level against first party order IDs, not modeled and not surveyed. The new visit to new customer conversion rate credits the channel that originated the new visit. Channels without cost data, including email, SMS, organic, and influencer, are left out of the cost comparisons. Snapchat is excluded for negligible spend. Pinterest is marked with an asterisk because it ran on a small number of new customers this week, so it is not used to anchor any headline. The channel labeled Facebook in the underlying platform data is shown here as Meta. Charts and tables carry meaning through direction, labels, and contrast rather than color alone.