

10 min read
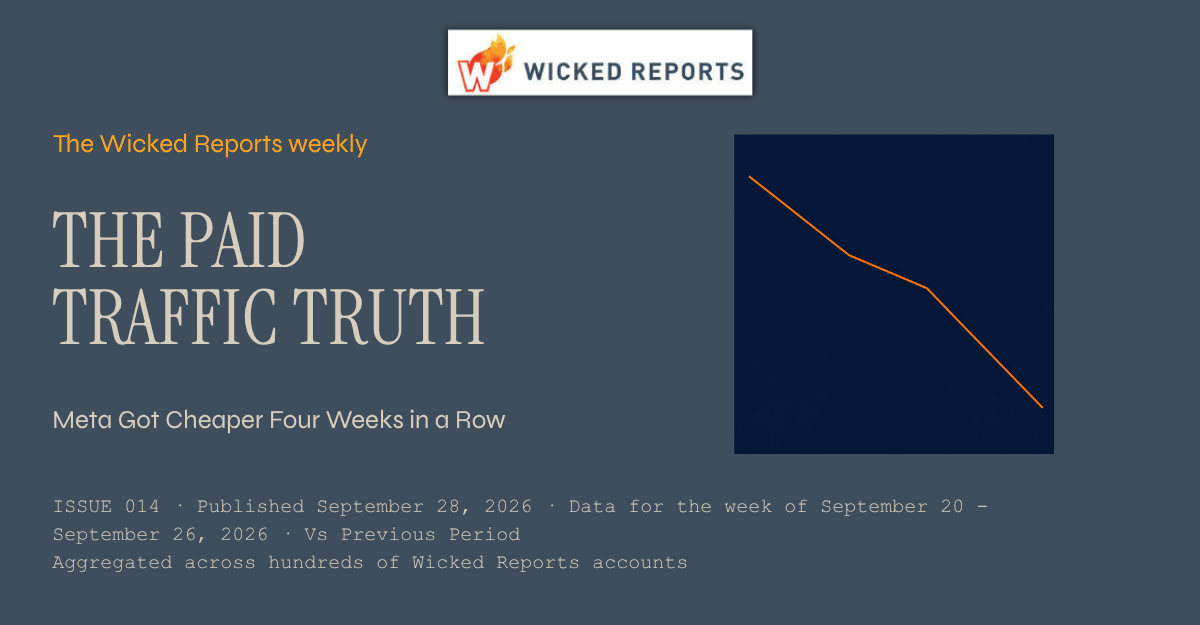
The Paid Traffic Truth : Why Meta's New Customer Cost Fell Four Weeks Straight
The Paid Traffic Truth — Issue 014
Published September 28,2026 * Data for the week of September 20 to September 26 2026 * Aggregated across hundreds of Wicked Reports accounts.
Meta Got Cheaper Four Weeks in a Row
September's noise was the holiday. September's signal was Meta. While the other channels bounced around Labor Day and back, the verified cost of a new customer on Meta fell every single week of the month, and it is doing it with the highest share of genuinely new buyers of any channel. If you are setting Q4 budgets on last quarter's Meta numbers, they are already stale.
This week's number
Meta's verified nCAC fell a fourth consecutive week to $74, down from $85 a month ago, a 13% decline at a steady 91% new-buyer share.
01 / Introduction
The quietest trend of the month is the biggest one
For three issues running, Meta's falling new customer cost has been a side note while louder stories took the headline. It has now earned the headline. Four weeks, four declines: $85, $82, $78, $74. On the channel carrying half of all tracked spend in this data set, that is not a footnote. That is the market moving.
This issue looks at what is behind the run and what it should change about Q4 planning, then walks the same four verified grids as every week: new customer acquisition, first click versus last click, overall channel performance, and new customer lifetime value. All first-party, order-verified data aggregated across hundreds of Wicked Reports accounts. No modeling, no surveys.
02 / Analysis
Four weeks down, and the new-buyer share never budged
A falling acquisition cost is only good news if the customers are real. The first thing I checked across all four weeks is the quality of what Meta is delivering, and it held. The share of Meta's tracked customers who are verified first-time buyers stayed at 90% to 91% the entire month, the highest of any channel, and the markup between blended CAC and true new customer cost stayed pinned at 10% to 11%. The decline is not repeat buyers sneaking into the mix and dragging the average down. Meta is buying genuinely new customers, and the price keeps dropping.
The holiday question is the obvious objection, and the chart answers it. The first two declines happened during the Labor Day run-up and the holiday week itself, when discovery channels always get a temporary discount, and I said at the time not to treat that cheapness as a baseline. But the holiday unwound weeks ago. Search costs snapped back. Meta kept falling anyway, through two clean weeks, which is what separates a calendar effect from a trend.
What I cannot yet give you is the cause. This week's decline came with conversion nearly flat and click prices nearly flat, so the drop is not better auction prices and not better site conversion. That points to mix: which accounts, campaigns, and products the spend is flowing through. One candidate worth naming is that Meta's share of tracked spend has drifted down for three straight weeks, from 53.5% to 50.1%, and when marginal dollars leave a channel, the budget that remains tends to be concentrated in its strongest campaigns, which improves the average. That is a hypothesis, not a finding. The trend is verified. The mechanism is not, and I would rather tell you that than invent a clean story.
03 / New Customer Acquisition
The full acquisition picture, by channel
Elsewhere in the grid: Google settled a second week at $167 with conversion up 4%, so search is back to its normal shape after the holiday. YouTube gave back part of last week's big drop, landing at $430 with 76% new buyers, still well below its August range of roughly $800, and worth continued attention. Microsoft had an odd week, with conversion up 5% but click prices up 9%, pushing its nCAC to $186. TikTok whipsawed downward again and returns to thin-data status, which is why I do not trade on its weekly reads.
04 / First Click vs Last Click
Who starts the sale vs who takes the bow
The Meta row is the reason a month-long trend like this stays invisible on most dashboards. Meta is under-credited on last click, so a chunk of the new customers it keeps acquiring more cheaply gets booked to whatever search ad closed the journey. If your reporting runs on last click, your Meta improved all month and your dashboard split the credit with Google.
05 / Overall Channel Performance
Where the money goes, and THE TRUE COST OF A NEW CUSTOMER
The standing pattern holds even in Meta's best month. Google posts a ROAS of 1.32 against Meta's 0.51, and a new customer still costs 126% more on Google. The 56% markup between Google's blended CAC and its true new customer cost is repeat demand doing the flattering. Meta's 10% markup means the cheap number on its row is almost entirely new business. If Q4 budgets get set on the ROAS column, the money moves in exactly the wrong direction.
06 / New Customer Lifetime Value
What a new customer becomes over a year
The LTV grid shows why the four-week run matters more than a discount usually would. Meta has always been the thin-margin channel in this data set: a low first order that grows to $108 at one year, against an acquisition cost that used to leave little room. A month ago that spread was $111 of value against $82 of cost. This week it is $108 against $74. Same value curve, meaningfully more margin. The standing caveat applies: this grid blends brands at very different price points, so treat it as a directional market benchmark, not a promise for any one store.
07 / Conclusion
Re-pull your Meta number before you lock Q4
Black Friday budgets are being finalized right now, and most of them are being built on Meta nCAC assumptions from July or August. This data says the market's number has moved 13% in a month. If your plan still carries the old figure, your Q4 model is conservative in the one place you might not want it to be, and if you are pacing spend to a target nCAC, you may be leaving volume on the table at a price you would happily pay.
The move this week: pull your own verified Meta nCAC for September, not the platform-reported number, and check it against whatever figure is sitting in your Q4 plan. Then check your new-buyer share alongside it, because a cheap Meta number only helps if it is buying new customers rather than recycling old ones. The aggregate trend is real, but your account is not the aggregate, and the only version of this number worth planning on is your own.
See your own version of these four grids.
Your real nCAC next to your aCAC, your first versus last click gap, your new customer LTV by channel, in your own account.
Get the Paid Traffic Truth Report directly to your inbox.
How this week's numbers were built. Aggregated across hundreds of Wicked Reports client accounts for the week of September 20 to September 26, 2026, except first click vs last click, which uses a rolling 90 day window. New versus repeat is verified at the order level against first party order IDs, not modeled and not surveyed. The new visit to new customer conversion rate credits the channel that originated the new visit. Channels without cost data, including email, SMS, organic, and influencer, are left out of the cost comparisons. Snapchat is excluded for negligible spend. Pinterest is marked with an asterisk because it ran on a small number of new customers this week, so it is not used to anchor any headline. The channel labeled Facebook in the underlying platform data is shown here as Meta. Charts and tables carry meaning through direction, labels, and contrast rather than color alone.