

10 min read
The Paid Traffic Truth : Paid Traffic Enters Q4 Cheaper Than It Left August
The Paid Traffic Truth — Issue 015
Published October 05,2026 * Data for the week of September 27 to October 03 2026 * Aggregated across hundreds of Wicked Reports accounts.
Paid Traffic Enters Q4 Cheaper Than It Left August
September threw a holiday spike, a month-long Meta slide, and a YouTube reset at the market. Now the month is closed and the noise has washed out, and the net result is simple: the two channels carrying 92% of tracked spend enter Q4 at or below where they ended August. These are the baseline numbers to judge the Q4 ramp against, and the ramp is the next thing coming.
This week's number
The September round trip is complete. Meta enters October at $76, 11% cheaper than late August. Google enters at $160, flat to where it started, with the holiday spike fully unwound.
01 / Introduction
The month closed. Here is where it left you.
This is the first issue of October, so before the weekly grids, this one does something the series has not done before: it closes out a full month. Five weeks of verified data covered the Labor Day run-up, the holiday itself, two clean recovery weeks, and now the first week of Q4 proper. Every one of those weeks moved some channel around. The question that matters for planning is what survived the round trip.
The answer is below, followed by the same four verified grids as every week: new customer acquisition, first click versus last click, overall channel performance, and new customer lifetime value. All first-party, order-verified data aggregated across hundreds of Wicked Reports accounts. No modeling, no surveys.
02 / Analysis
One chart, the whole month
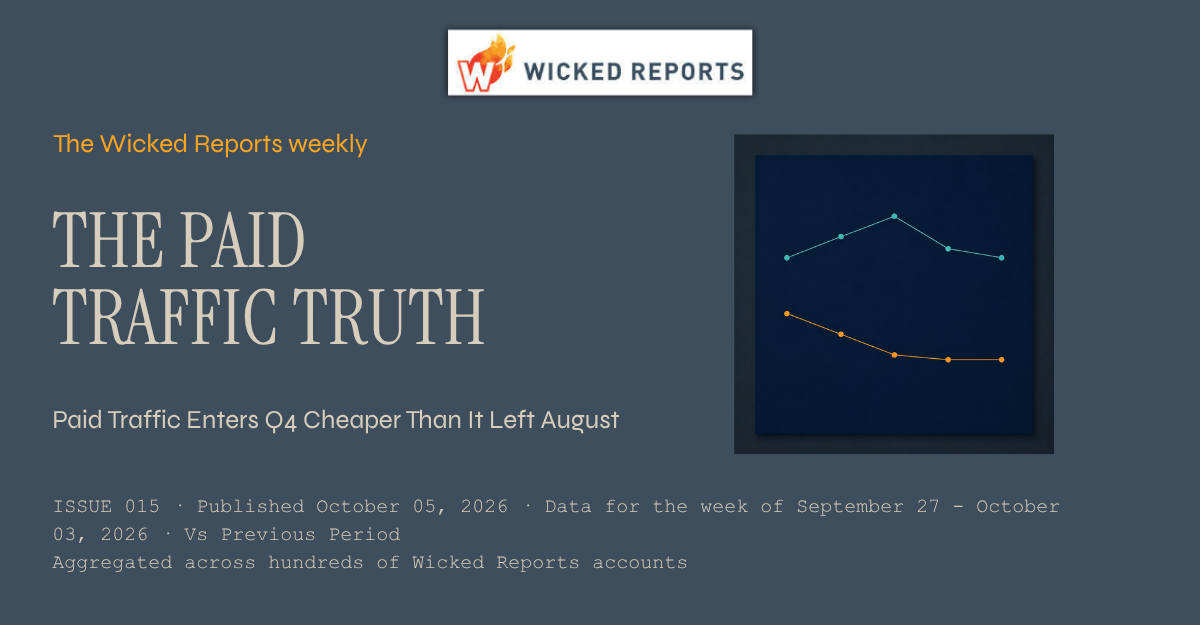
Here is September in a single picture: verified nCAC for the two largest channels, all five weeks.
Two stories ran through September, and they ended differently. Google's story was the holiday: Labor Day pushed its new customer cost from $161 to $179, and three consecutive declining weeks brought it back to $160, with conversion up 3% this week. A complete round trip. If you panicked about Google in mid September or celebrated it this week, you were reacting to the calendar both times.
Meta's story was not the holiday, and that is the part worth carrying into Q4. Its decline ran through the holiday weeks and the clean weeks alike, $85 to $74 over four weeks, before ticking up 2% to $76 this week on softer conversion. One week is a data point, not a reversal, so the honest read is that the slide has stopped and the channel has settled at a level about 11% below late August. The quality held the entire time: 91% of Meta's tracked customers are verified first-time buyers, same as every week this month, with the markup over blended CAC now at 9%. The cause of the slide is still what it was last week, a mix story rather than cheaper auctions, and still unproven. The level itself is verified either way.
Why this matters right now: the Q4 ramp is the next structural event on the calendar. As BFCM spend floods the auctions over the coming weeks, costs will climb, and every brand will face the same question at every weekly check-in: is this seasonal inflation I planned for, or is my account deteriorating? You cannot answer that without knowing precisely where you started. This month-end snapshot is the market's starting line. Yours is in your own account.
03 / New Customer Acquisition
The full acquisition picture, by channel
Beyond the two headliners: Microsoft drifted up again to $191 and has now round-tripped the holiday in the wrong direction, the one major channel entering October more expensive than it entered September. YouTube settled a second week in the low $400s, still well below its August range, with a soft conversion week. TikTok collapsed back to thin-data status with a new-buyer share that fell to 51%, its fourth violent swing in four weeks, which is exactly why thin channels never anchor a conclusion here.
04 / First Click vs Last Click
Who starts the sale vs who takes the bow
This grid is a measurement reconciliation, not an investment case. It explains why the platforms' own dashboards disagreed with the verified numbers all month: last click shifts credit from the channels that open journeys toward the channels that close them, so a last-click view understated Meta's September and flattered the search channels. When you compare your Q4 numbers against a baseline, make sure both were measured under the same model, or the comparison is meaningless before you start.
05 / Overall Channel Performance
Where the money goes, and THE TRUE COST OF A NEW CUSTOMER
The standing pattern survives the month-end accounting intact. Google's ROAS is 2.7x Meta's, and a new customer still costs 111% more there, because its 54% markup between blended CAC and true new customer cost is repeat demand doing the flattering. Meta's 9% markup is the tightest in the grid. Whatever the Q4 auctions do to these numbers, the ROAS column will keep ranking the channels in the wrong order for growth, and that does not change with the season.
06 / New Customer Lifetime Value
What a new customer becomes over a year
The value side barely moved all month, which is the point of this grid. Acquisition costs swung with the calendar while what a new customer becomes stayed steady: Meta's one-year value sat within a few dollars of $108 every week, Google's near $243. That stability is what makes the cost side plannable. Your Q4 question is not whether customers will be worth less, it is what you will pay to get them. The standing caveat applies: this grid blends brands at very different price points, so treat it as a directional market benchmark, not a promise for any one store.
07 / Conclusion
Write down your starting line this week
The market enters Q4 with Meta around $76 and 11% cheaper than late August, Google flat at $160, Microsoft slightly elevated, and YouTube settled well below its summer range. Clean entry conditions, about eight weeks out from BFCM, with the spend ramp ahead of it.
The move this week takes twenty minutes. Pull your own verified September numbers per channel, nCAC and new-buyer share, and write them down as your Q4 baseline before October data starts piling on top of them. Then judge every week of the ramp against that line. When your Meta nCAC reads 30% higher in early November, the baseline is what tells you whether that is the seasonal inflation everyone pays or a problem that is yours alone. Brands that skip this step spend November arguing about numbers nobody wrote down in October.
See your own version of these four grids.
Your real nCAC next to your aCAC, your first versus last click gap, your new customer LTV by channel, in your own account.
Get the Paid Traffic Truth Report directly to your inbox.
How this week's numbers were built. Aggregated across hundreds of Wicked Reports client accounts for the week of September 27 to October 03, 2026, except first click vs last click, which uses a rolling 90 day window. New versus repeat is verified at the order level against first party order IDs, not modeled and not surveyed. The new visit to new customer conversion rate credits the channel that originated the new visit. Channels without cost data, including email, SMS, organic, and influencer, are left out of the cost comparisons. Snapchat is excluded for negligible spend. Pinterest is marked with an asterisk because it ran on a small number of new customers this week, so it is not used to anchor any headline. The channel labeled Facebook in the underlying platform data is shown here as Meta. Charts and tables carry meaning through direction, labels, and contrast rather than color alone.
Topics: Wicked Reports New Customer Acquisition Cost (NCAC) Meta Ads Paid Traffic Truth paid media measurement BFCM Q4 Budget Planning
10 min read
The Paid Traffic Truth : Why Meta's New Customer Cost Fell Four Weeks Straight
The Paid Traffic Truth — Issue 014
Published September 28,2026 * Data for the week of September 20 to September 26 2026 * Aggregated across hundreds of Wicked Reports accounts.
Meta Got Cheaper Four Weeks in a Row
September's noise was the holiday. September's signal was Meta. While the other channels bounced around Labor Day and back, the verified cost of a new customer on Meta fell every single week of the month, and it is doing it with the highest share of genuinely new buyers of any channel. If you are setting Q4 budgets on last quarter's Meta numbers, they are already stale.
This week's number
Meta's verified nCAC fell a fourth consecutive week to $74, down from $85 a month ago, a 13% decline at a steady 91% new-buyer share.
01 / Introduction
The quietest trend of the month is the biggest one
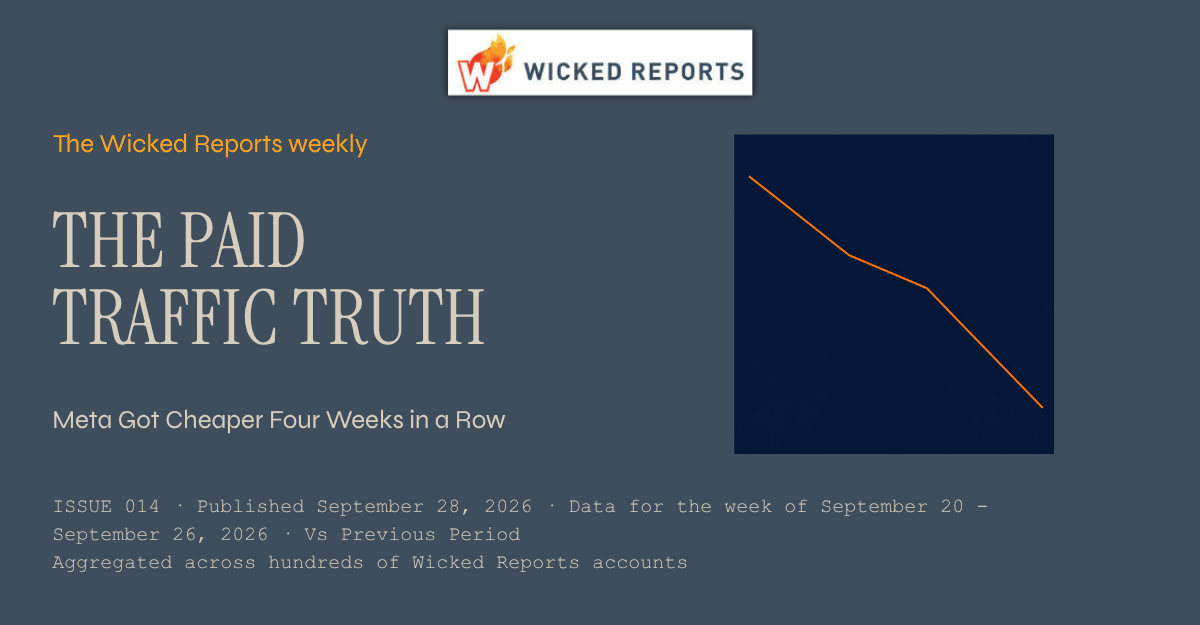
For three issues running, Meta's falling new customer cost has been a side note while louder stories took the headline. It has now earned the headline. Four weeks, four declines: $85, $82, $78, $74. On the channel carrying half of all tracked spend in this data set, that is not a footnote. That is the market moving.
This issue looks at what is behind the run and what it should change about Q4 planning, then walks the same four verified grids as every week: new customer acquisition, first click versus last click, overall channel performance, and new customer lifetime value. All first-party, order-verified data aggregated across hundreds of Wicked Reports accounts. No modeling, no surveys.
02 / Analysis
Four weeks down, and the new-buyer share never budged
A falling acquisition cost is only good news if the customers are real. The first thing I checked across all four weeks is the quality of what Meta is delivering, and it held. The share of Meta's tracked customers who are verified first-time buyers stayed at 90% to 91% the entire month, the highest of any channel, and the markup between blended CAC and true new customer cost stayed pinned at 10% to 11%. The decline is not repeat buyers sneaking into the mix and dragging the average down. Meta is buying genuinely new customers, and the price keeps dropping.
The holiday question is the obvious objection, and the chart answers it. The first two declines happened during the Labor Day run-up and the holiday week itself, when discovery channels always get a temporary discount, and I said at the time not to treat that cheapness as a baseline. But the holiday unwound weeks ago. Search costs snapped back. Meta kept falling anyway, through two clean weeks, which is what separates a calendar effect from a trend.
What I cannot yet give you is the cause. This week's decline came with conversion nearly flat and click prices nearly flat, so the drop is not better auction prices and not better site conversion. That points to mix: which accounts, campaigns, and products the spend is flowing through. One candidate worth naming is that Meta's share of tracked spend has drifted down for three straight weeks, from 53.5% to 50.1%, and when marginal dollars leave a channel, the budget that remains tends to be concentrated in its strongest campaigns, which improves the average. That is a hypothesis, not a finding. The trend is verified. The mechanism is not, and I would rather tell you that than invent a clean story.
03 / New Customer Acquisition
The full acquisition picture, by channel
Elsewhere in the grid: Google settled a second week at $167 with conversion up 4%, so search is back to its normal shape after the holiday. YouTube gave back part of last week's big drop, landing at $430 with 76% new buyers, still well below its August range of roughly $800, and worth continued attention. Microsoft had an odd week, with conversion up 5% but click prices up 9%, pushing its nCAC to $186. TikTok whipsawed downward again and returns to thin-data status, which is why I do not trade on its weekly reads.
04 / First Click vs Last Click
Who starts the sale vs who takes the bow
The Meta row is the reason a month-long trend like this stays invisible on most dashboards. Meta is under-credited on last click, so a chunk of the new customers it keeps acquiring more cheaply gets booked to whatever search ad closed the journey. If your reporting runs on last click, your Meta improved all month and your dashboard split the credit with Google.
05 / Overall Channel Performance
Where the money goes, and THE TRUE COST OF A NEW CUSTOMER
The standing pattern holds even in Meta's best month. Google posts a ROAS of 1.32 against Meta's 0.51, and a new customer still costs 126% more on Google. The 56% markup between Google's blended CAC and its true new customer cost is repeat demand doing the flattering. Meta's 10% markup means the cheap number on its row is almost entirely new business. If Q4 budgets get set on the ROAS column, the money moves in exactly the wrong direction.
06 / New Customer Lifetime Value
What a new customer becomes over a year
The LTV grid shows why the four-week run matters more than a discount usually would. Meta has always been the thin-margin channel in this data set: a low first order that grows to $108 at one year, against an acquisition cost that used to leave little room. A month ago that spread was $111 of value against $82 of cost. This week it is $108 against $74. Same value curve, meaningfully more margin. The standing caveat applies: this grid blends brands at very different price points, so treat it as a directional market benchmark, not a promise for any one store.
07 / Conclusion
Re-pull your Meta number before you lock Q4
Black Friday budgets are being finalized right now, and most of them are being built on Meta nCAC assumptions from July or August. This data says the market's number has moved 13% in a month. If your plan still carries the old figure, your Q4 model is conservative in the one place you might not want it to be, and if you are pacing spend to a target nCAC, you may be leaving volume on the table at a price you would happily pay.
The move this week: pull your own verified Meta nCAC for September, not the platform-reported number, and check it against whatever figure is sitting in your Q4 plan. Then check your new-buyer share alongside it, because a cheap Meta number only helps if it is buying new customers rather than recycling old ones. The aggregate trend is real, but your account is not the aggregate, and the only version of this number worth planning on is your own.
See your own version of these four grids.
Your real nCAC next to your aCAC, your first versus last click gap, your new customer LTV by channel, in your own account.
Get the Paid Traffic Truth Report directly to your inbox.
How this week's numbers were built. Aggregated across hundreds of Wicked Reports client accounts for the week of September 20 to September 26, 2026, except first click vs last click, which uses a rolling 90 day window. New versus repeat is verified at the order level against first party order IDs, not modeled and not surveyed. The new visit to new customer conversion rate credits the channel that originated the new visit. Channels without cost data, including email, SMS, organic, and influencer, are left out of the cost comparisons. Snapchat is excluded for negligible spend. Pinterest is marked with an asterisk because it ran on a small number of new customers this week, so it is not used to anchor any headline. The channel labeled Facebook in the underlying platform data is shown here as Meta. Charts and tables carry meaning through direction, labels, and contrast rather than color alone.
Topics: Wicked Reports New Customer Acquisition Cost (NCAC) Meta Ads Paid Traffic Truth paid media measurement Q4 Budget Planning Verified Attribution
10 min read
The Paid Traffic Truth : Why YouTube's New Customer Cost Just Reset
The Paid Traffic Truth — Issue 013
Published September 21,2026 * Data for the week of September 13 to September 19 2026 * Aggregated across hundreds of Wicked Reports accounts.
YouTube's New Customer Math Just Reset
Everyone spent September watching Meta and Google trade holiday effects. Meanwhile the biggest verified move of the week happened on the channel most brands wrote off as unmeasurable. YouTube's cost of a new customer fell by nearly half, and the give-back from the holiday only explains part of it.
This week's number
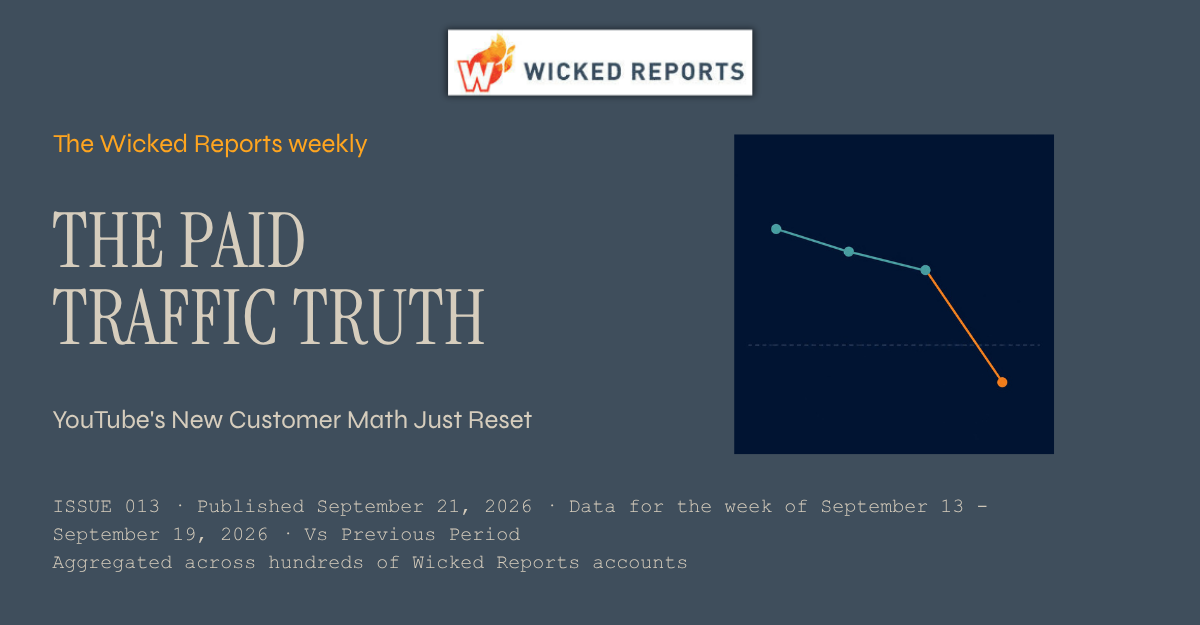
YouTube's verified nCAC fell 43% in one week, from $629 to $360, while new visit to customer conversion rose 54% and its new-customer share jumped from 56% to 79%.
01 / Introduction
First, the receipt. Then the actual news.
Last issue ended with a prediction: the Labor Day effect would give something back, and I would report it either way. Here is the scorecard. Search snapped back on cue, with Google's nCAC down 4% to $172 and conversion up on both Google and Microsoft. Meta, meanwhile, never gave anything back. Third straight week of falling new customer cost, now at $78. The full grids are below.
But the real story of the week is not the two channels everyone watches. It is the one most brands quietly gave up on measuring. This issue tells that story, then walks the same four verified grids as always: new customer acquisition, first click versus last click, overall channel performance, and new customer lifetime value. All first-party, order-verified, aggregated across hundreds of Wicked Reports accounts. No modeling, no surveys.
02 / Analysis
Video's quiet reset, and how much of it is real
Three YouTube numbers moved together this week, and the combination matters more than any one of them. Verified nCAC fell 43% to $360. New visit to customer conversion rose 54%. And the share of YouTube's tracked customers who are genuinely new jumped from 56% to 79%, which pulled its markup over blended CAC down from 79% to 25%. Click prices were flat. This was not YouTube getting cheaper to click. It was YouTube traffic converting better and skewing much harder toward first-time buyers.
Why does this matter beyond one channel's good week? Because YouTube is the channel where the measurement excuse runs deepest. Views happen on a TV screen, the click comes days later from a phone, last-click reporting hands the sale to search, and the line item gets cut. This week, verified at the order level, that supposedly unmeasurable channel bought a new customer for $360 while carrying the second-highest new-customer share of any paid channel at 79%, behind only Meta's 91%. Video is prospecting almost by definition, and this week the prospecting got dramatically more efficient.
The honest note, and this one needs to be firm. This is one week of data on a channel carrying 4.3% of tracked spend, so a smaller pool of accounts can move the aggregate more than it could on Meta or Google. Part of the drop is plain post-holiday normalization, because YouTube's cost inflated through the holiday weeks. But the give-back defense only stretches so far: a return to normal would land YouTube back in its pre-holiday range, and $360 is far below it, with the new-customer mix shift pointing the same direction. I am calling this a watch-list item, not a scale signal. If nCAC holds under roughly $450 next week with the new share staying near 80%, it starts to look structural. One week is never a budget decision.
03 / New Customer Acquisition
The full acquisition picture, by channel
Beyond the YouTube row, note the search recovery I promised to report: Google and Microsoft conversion both climbed as the holiday effect unwound, exactly the snap-back Issue 011 predicted. TikTok swung violently the other way, conversion up 329% and nCAC down 80% to $227, but it whipsawed just as hard downward the week before, so I treat its week-to-week reads as noise until it strings a few together. Meta keeps grinding cheaper, a story we are now watching closely into Q4.
04 / First Click vs Last Click
Who starts the sale vs who takes the bow
The YouTube row here is the reason this week's reset went unnoticed on most dashboards. Video is under-credited on last click, so the platforms handing out credit gave a piece of YouTube's improvement to the search box that closed the journey. If your reporting runs on last click, your YouTube got cheaper this week and your dashboard told you Google did it.
05 / Overall Channel Performance
Where the money goes, and THE TRUE COST OF A NEW CUSTOMER
Look at YouTube's markup column against the search channels. A week ago video carried a 79% penalty between blended CAC and true new customer cost. This week it is 25%, tighter than Google's 58% and Microsoft's 70%. Search still posts the pretty ROAS numbers, and search is still where blended CAC most flatters the real cost of growth. The standing lesson of this grid does not change: the channels that look most efficient on ROAS are the ones borrowing most heavily from demand that already existed.
06 / New Customer Lifetime Value
What a new customer becomes over a year
This grid is what turns YouTube's cheap week into a real economics question. A YouTube customer starts at $79 and nearly triples inside 30 days to $233, the steepest early payback curve of any paid channel, reaching $261 at one year. Judged on day-zero math, a $360 nCAC against a $79 first order looks indefensible. Judged on the 30-day number, the gap nearly closes on click-credited revenue alone, before any view-through contribution. The standing caveat applies: this grid blends brands at very different price points, so it is a directional market benchmark, not a promise for any one store.
07 / Conclusion
Put video on the watch list, with a number attached
The September story so far: the holiday came and went, search snapped back, Meta keeps getting quietly cheaper, and now video just posted the biggest verified efficiency move of the month while most dashboards handed the credit to the search box. None of that is visible on last click, and none of it is visible on ROAS.
The move this week is specific. Pull your own YouTube new customer cost, verified against orders, not platform-reported. Write down this week's number and the new-customer share next to it. If both hold through next week, you have an early position on a channel most of your competitors stopped measuring years ago. That is the entire advantage: not spending more, just knowing sooner. I will publish what the aggregate did either way.
See your own version of these four grids.
Your real nCAC next to your aCAC, your first versus last click gap, your new customer LTV by channel, in your own account.
Get the Paid Traffic Truth Report directly to your inbox.
How this week's numbers were built. Aggregated across hundreds of Wicked Reports client accounts for the week of September 13 to September 19, 2026, except first click vs last click, which uses a rolling 90 day window. New versus repeat is verified at the order level against first party order IDs, not modeled and not surveyed. The new visit to new customer conversion rate credits the channel that originated the new visit. Channels without cost data, including email, SMS, organic, and influencer, are left out of the cost comparisons. Snapchat is excluded for negligible spend. Pinterest is marked with an asterisk because it ran on a small number of new customers this week, so it is not used to anchor any headline. The channel labeled Facebook in the underlying platform data is shown here as Meta. Charts and tables carry meaning through direction, labels, and contrast rather than color alone.
Topics: Wicked Reports New Customer Acquisition Cost (NCAC) Paid Traffic Truth YouTube Ads Video Prospecting First Click vs Last Click Attribution
10 min read
The Paid Traffic Truth : Why Holiday Demand Pays Meta and Bills Google
The Paid Traffic Truth — Issue 012
Published September 14,2026 * Data for the week of September 06 to September 12 2026 * Aggregated across hundreds of Wicked Reports accounts.
The Holiday Kept Paying Meta and Kept Billing Google
Last week I told you the Labor Day run-up made discovery channels cheaper and search more expensive. This week contained the holiday itself, and the split did not soften. It widened. If you run both Meta and Google, the same calendar event just moved your two biggest channels in opposite directions for the second week in a row.
This week's number
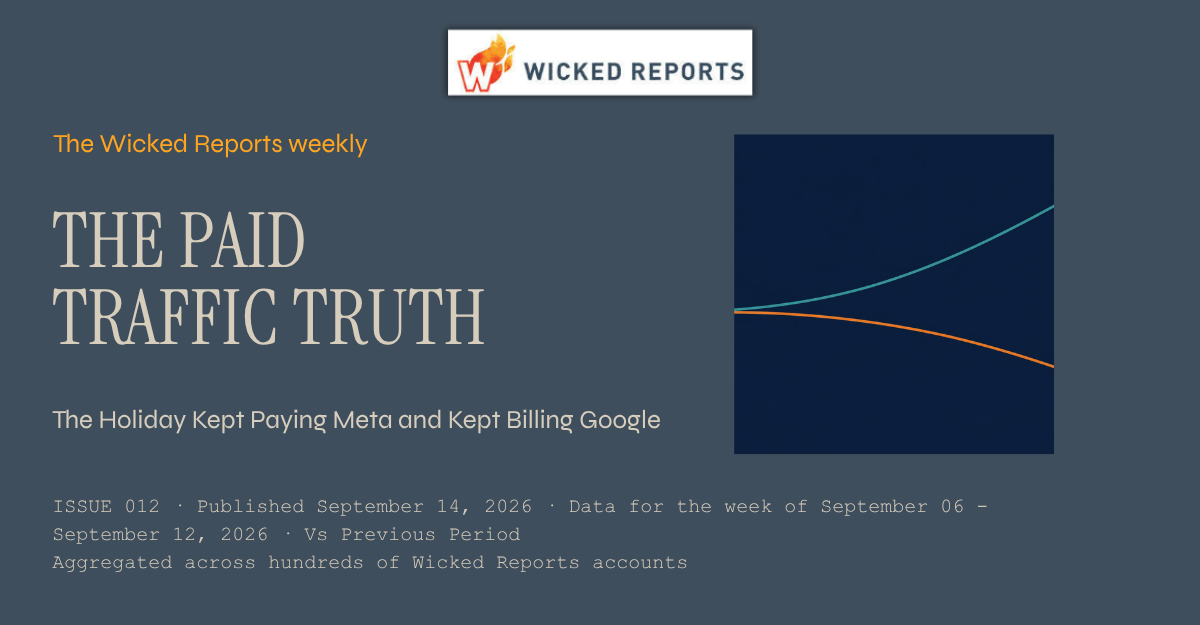
Google's verified new customer cost climbed a second straight week, up 11% to $179, while Meta's fell again to $82. Same holiday. Opposite bills.
01 / Introduction
Labor Day, part two. The split held.
In Issue 011 I flagged that the Labor Day run-up was making everyone's ads look smarter than they are, with one exception : Google, the lone major channel where the cost of a new customer went up while everything else got cheaper. I also said this week's data would contain the holiday weekend itself, so we would find out whether that was noise or a pattern.
It was a pattern. This issue tells that one story, then walks the same four verified grids we publish every week: new customer acquisition, first click versus last click, overall channel performance, and new customer lifetime value. All of it is first-party, order-verified data aggregated across hundreds of Wicked Reports accounts. No modeling, no surveys.
02 / Analysis
Holiday demand is discovery demand. Two weeks of receipts.
Here is what the week of the holiday itself did to the two channels that carry 93% of tracked spend. Meta's verified nCAC fell 4% to $82, with new visit to customer conversion up 7% and click prices down 6%. Google's nCAC rose 11% to $179, with conversion down 5% and click prices barely moving. That is the second consecutive week the two lines have moved apart.
The mechanism is the one I named last week, now with confirmation. A holiday puts people in browse mode. Feeds fill with deal creative and shoppers buy things they were not searching for, which is why Meta converted better and got cheaper. Search works the opposite way. Holiday buyers who would have typed a brand name into Google got intercepted upstream by a feed ad, so search traffic skewed toward comparison shoppers and its conversion slipped. Microsoft, the other search channel in the set, told the same story louder: conversion down 13% and nCAC up 26% to $171. When both search channels move together against both discovery patterns, that is not one platform having a bad week. That is demand changing shape.
The honest note. This is still a calendar story, not a structural one. Two weeks of divergence is a holiday arc playing out exactly as a holiday arc should: the run-up week, then the holiday week itself. The structural part is the lesson, not the numbers. Holiday demand reliably flows to discovery channels and drains search, and it will do it again in November, at much larger dollar amounts. Do not read Google's $179 as its new baseline, and do not read Meta's $82 as your media buyer's genius. Next week's data should show the give-back, and I will report it either way.
03 / New Customer Acquisition
The full acquisition picture, by channel
Two things beyond the headline. Meta is running 90% new customers, the highest new share of any major channel, which means its cheap acquisition really is acquisition and not repeat business dressed up. And the search-side softness was not just Google: Microsoft's conversion fell harder than anyone's. TikTok gave back its recent volume and returns to thin-data status this week, so I am not reading anything into its swing.
04 / First Click vs Last Click
Who starts the sale vs who takes the bow
This grid explains why holiday weeks fool last-click reporting. The discovery channels that start the sale, Meta especially, are under-credited on last click, while both search channels are over-credited because they close journeys the feed started. In a week where feeds did the heavy lifting, your last-click dashboard handed even more of Meta's holiday work to Google. If you rebalanced budget off that view this week, you rewarded the closer and cut the opener.
05 / Overall Channel Performance
Where the money goes, and THE TRUE COST OF A NEW CUSTOMER
Note the standing trap in this grid. Google still posts nearly 3x Meta's ROAS, and it is still the more expensive place to buy a new customer, by 118% this week. Search ROAS is inflated by closing credit and repeat purchases; Meta's 11% markup between aCAC and nCAC says almost everything it acquires is genuinely new. If you allocate on ROAS alone, this week you would have shifted holiday budget toward the channel whose new customer cost just climbed twice.
06 / New Customer Lifetime Value
What a new customer becomes over a year
The LTV grid is why the holiday split matters beyond one week. A Google new customer is worth $241 at one year against a $179 acquisition cost, so search can absorb some holiday inflation and still pay back. A Meta customer at $111 against $82 is a thinner margin that depends on that cheap nCAC holding. One standing caveat: this grid blends brands at very different price points, so treat it as a directional market benchmark, not a promise for any one store.
07 / Conclusion
Tag both weeks, then wait for the give-back
Two weeks of Labor Day data now say the same thing. Holiday demand flows to discovery and drains search, and last-click reporting hides it by handing the feed's work to the search box. If your Meta looked brilliant and your Google looked broken these two weeks, neither is true. The calendar did both.
The move this week is bookkeeping, not budget. Tag Aug 30 through Sep 12 as holiday-affected in whatever you use to judge performance, benchmark them against past holiday windows instead of ordinary weeks, and write down what your verified nCAC did on each channel. That note is your playbook for Black Friday, when this exact pattern returns with ten times the money on the table. Next issue we find out how much of this snaps back. your own version of these four grids
See your own version of these four grids.
Your real nCAC next to your aCAC, your first versus last click gap, your new customer LTV by channel, in your own account.
Get the Paid Traffic Truth Report directly to your inbox.
How this week's numbers were built. Aggregated across hundreds of Wicked Reports client accounts for the week of September 06 to September 12, 2026, except first click vs last click, which uses a rolling 90 day window. New versus repeat is verified at the order level against first party order IDs, not modeled and not surveyed. The new visit to new customer conversion rate credits the channel that originated the new visit. Channels without cost data, including email, SMS, organic, and influencer, are left out of the cost comparisons. Snapchat is excluded for negligible spend. Pinterest is marked with an asterisk because it ran on a small number of new customers this week, so it is not used to anchor any headline. The channel labeled Facebook in the underlying platform data is shown here as Meta. Charts and tables carry meaning through direction, labels, and contrast rather than color alone.
Topics: Wicked Reports New Customer Acquisition Cost (NCAC) Paid Traffic Truth paid media measurement paid traffic attribution Holiday Demand
10 min read
The Paid Traffic Truth : Why Labor Day Made Your Ads Look Smarter Than They Are
The Paid Traffic Truth — Issue 011
Published September 7,2026 * Data for the week of August 30 to September 05 2026 * Aggregated across hundreds of Wicked Reports accounts.
Why Labor Day Made Your Ads Look Smarter Than They Are
The common assumption about a holiday sale week is that demand goes up and so do costs, because everyone is bidding into the same auction. This week's verified data says the first half is true and the second half is backwards. Conversion jumped on nearly every channel, and the cost of a new customer fell almost everywhere. The danger is what your team does with numbers this good.
This week's number
In the Labor Day run-up, Meta's new visit to customer conversion jumped 22% and its nCAC fell to $85. Your ads did not get better. The calendar did.
01 / Introduction
The holiday week test
Every week we aggregate first-party, order-verified data across hundreds of eCommerce accounts and publish the four grids: new customer acquisition, first click versus last click, overall channel performance, and new customer lifetime value. One story per issue. This week the story is what a holiday sale week actually does to your acquisition numbers, because this data week ran from August 30 through September 5, the run-up to Labor Day and the Saturday of the holiday weekend itself.
I want to answer two questions honestly. Did the holiday produce more sales? Yes, clearly. Did it drive costs up? Mostly no, and that surprise is the lesson.
02 / Analysis
More buyers, cheaper new customers, one exception
Here is what the sale week did. New visit to customer conversion rose on almost every channel: Meta up 22%, YouTube up 50%, organic up 30% week over week. Shoppers in a buying mood convert faster on the same clicks. And because conversion rose faster than click prices did, the cost of a verified new customer fell across nearly the whole paid grid. Meta's CPC actually rose about 4%, and its nCAC still dropped to $85.
Now the exception, because it is the most interesting row on the chart. Google was the only major channel where things got worse: conversion down 6%, nCAC up 4% to $161. Holiday demand this week was discovery demand. People scrolling a feed saw a sale and bought. They were not typing product searches into Google. When the buying impulse comes from the calendar instead of from intent, social and video channels harvest it and search sits it out. If you moved budget toward search for the holiday because search is your "reliable" channel, you paid more per new customer than the brands who let the feed channels run.
Here is the honest note, and this week it is the entire point. Every improvement on this page is a calendar artifact, not a structural change. Sale weeks pull demand forward and put shoppers in a converting mood, so every channel's numbers flatter the people running them. The trap is attribution of skill: the media buyer credits the new creative, the platform credits its algorithm, and next week, when a chunk of this demand has been pulled forward and conversion gives some of this back, the same people will be asked what broke. Nothing will have broken. The calendar will have moved on. Benchmark this week against holiday weeks, not against next week. And because this data blends hundreds of accounts, no single brand's promotion moved these aggregates; this is the market-wide holiday effect.
03 / New Customer Acquisition
The full acquisition picture, by channel
Meta had the week you would design on a whiteboard: 88% of its buyers were new, conversion up 22%, and an $85 nCAC, its cheapest of the past month. YouTube's conversion snapped back 50% after last week's slump, pulling its nCAC from $826 down to $520, a reminder that low-volume channels swing hard in both directions. TikTok more than doubled its conversion rate off a small base and cleared the thin-data bar this week, though one good holiday week is not a trend. Google is the row your CFO should ask about, and the answer is in the analysis above.
04 / First Click vs Last Click
Who starts the sale vs who takes the bow
The 90 day pattern held steady through the holiday: last click shortchanges the feed and video channels that open relationships and inflates the search channels that close them. Worth connecting to this week's story: the channels that under-credit on last click are the same ones that harvested the holiday demand. If your reporting is last click, the channels that just delivered your cheapest new customers of the month are the ones your dashboard is quietly punishing.
05 / Overall Channel Performance
Where the money goes, and THE TRUE COST OF A NEW CUSTOMER
Meta's CPC ticked up about 4% this week, the auction pressure everyone expects from a holiday. It did not matter, because conversion rose five times faster than clicks got pricier. That is the cost lesson of a sale week: click prices are the wrong thing to watch. The number that decides whether the holiday was profitable is what a verified new customer cost you, and on every major channel except Google, that number went down. Last week's markup story holds too, ranging from 12% on Meta to 63% on Pinterest, so blended CAC flattered every one of these rows even more than usual.
06 / New Customer Lifetime Value
What a new customer becomes over a year
One question worth asking about a sale week: are discount-driven buyers worth less over time? This grid cannot answer that yet, because these curves are built from cohorts acquired over the past year, not just this week. What it can tell you is the baseline to check against. Meta's holiday cohort came in at an $85 nCAC against a $110 one-year value benchmark, a thin margin that lives or dies on repeat purchase. If this week's cohort tracks below these curves at 30 and 90 days, the cheap holiday customers were not as cheap as they looked. Standard caveat: this grid blends brands at very different price points, so treat it as a directional market benchmark, not a promise for your store.
07 / Conclusion
Give the calendar its credit, then take it back
So, did Labor Day mean more sales or higher costs? More sales, cheaper new customers, and one search-shaped exception. Conversion rose nearly everywhere, nCAC fell on every major channel except Google, and the auction pressure that was supposed to make the holiday expensive never outran the buying mood.
The discipline is to log what actually happened. A holiday week that is not benchmarked as a holiday week becomes false evidence: proof the new creative works, proof the algorithm found its groove, proof you should scale into next week. Verify new versus repeat at the order level, tag the week for what it was, and judge next week against normal weeks. The brands that separate calendar effects from structural ones are the ones that scale the right thing when the holiday glow fades.
How this week's numbers were built. Aggregated across hundreds of Wicked Reports client accounts for the week of August 30 to September 05, 2026, except first click vs last click, which uses a rolling 90 day window. New versus repeat is verified at the order level against first party order IDs, not modeled and not surveyed. The new visit to new customer conversion rate credits the channel that originated the new visit. Channels without cost data, including email, SMS, organic, and influencer, are left out of the cost comparisons. Snapchat is excluded for negligible spend. Pinterest is marked with an asterisk because it ran on a small number of new customers this week, so it is not used to anchor any headline. The channel labeled Facebook in the underlying platform data is shown here as Meta. Charts and tables carry meaning through direction, labels, and contrast rather than color alone.
Topics: Wicked Reports New Customer Acquisition Cost (NCAC) Paid Traffic Truth Seasonal Benchmarking Holiday Conversion Lift
9 min read
The Paid Traffic Truth : The 159% Markup Hiding Inside Your Blended CAC
The Paid Traffic Truth — Issue 010
Published September 1,2026 * Data for the week of August 23 to August 29 2026 * Aggregated across hundreds of Wicked Reports accounts.
The 159% Markup Hiding Inside Your Blended CAC
Back in Issue 001 I showed you that the CAC on your dashboard is not the cost of a new customer. It is the cost of any customer, with cheap repeat buyers averaged in. Nine weeks later the pattern has not budged. This week the gap between the two numbers runs from 14% on Meta to 159% on YouTube, and if you budget off the blended number, you are paying for growth you are not getting.
This week's number
YouTube's blended CAC reads $319. A verified first-time customer costs $826. That 159% markup never shows up on a platform dashboard.
01 / Introduction
The two CACs, revisited
Every week we aggregate first-party, order-verified data across hundreds of eCommerce accounts and publish the four grids: new customer acquisition, first click versus last click, overall channel performance, and new customer lifetime value. One story per issue. This week the story is the markup between aCAC, the blended cost of acquiring any customer, and nCAC, the cost of acquiring a customer who has never bought from you before.
We ran this comparison in our very first issue. I am running it again on purpose, because the honest news is persistence. This is not a weekly anomaly you can wait out. It is a structural property of how blended CAC is calculated, and the size of the distortion depends entirely on which channel you are looking at.
02 / Analysis
Every channel marks up its blended CAC. Not equally.
The mechanism is simple. Blended CAC divides spend by all customers acquired, new and repeat alike. Repeat buyers convert cheaply because they already know you, so every repeat purchase mixed into the denominator pulls the average down. The more a channel leans on people who have already bought, the more flattering its blended CAC looks, and the bigger the surprise when you isolate true new customers.
Look at the shape of that chart. Meta's line is barely visible, a 14% markup, because 87% of Meta's tracked buyers this week were genuinely new. Meta's blended number and its new customer number are nearly the same number. Google marks up 51% at 66% new. Microsoft marks up 67% at 60% new. Then there is YouTube, where only 39% of buyers were new, and the markup explodes to 159%. The rule holds across the whole grid: the lower a channel's share of new buyers, the bigger the lie in its blended CAC.
One honest note on this week's magnitude. The markup pattern itself is structural. It comes from arithmetic and channel mix, not from the calendar, and it will look similar next week and the week after. But YouTube's specific 159% figure is elevated this week because YouTube's new visit to customer conversion dropped sharply week over week, which pushed its nCAC up hard while blended CAC moved less. Late August is a quiet stretch with no holiday selling event to blame, so read the direction as permanent and this week's YouTube extreme as the high end of its normal range. And because this data blends hundreds of accounts, no single brand's promotion can move these aggregates.
03 / New Customer Acquisition
The full acquisition picture, by channel
Meta keeps its spot as the volume engine, and at 87% new it is doing the job most brands assume all their paid channels are doing: bringing in people who have never bought. Google converts steadily at a defensible $154 nCAC. The row to sit with is YouTube. Only 39% of its buyers were new, its conversion rate fell by half week over week, and its nCAC landed at $826. If your dashboard shows YouTube at its blended $319, you are looking at a number that is mostly repeat purchase behavior wearing a prospecting costume.
04 / First Click vs Last Click
Who starts the sale vs who takes the bow
Same pattern as always: the social and video channels that open relationships get shortchanged by last click, and the search channels that close them get inflated. Notice this cuts the opposite way from the markup story. Last click makes YouTube look slightly worse than it is on revenue credit, while blended CAC makes it look wildly better than it is on new customer cost. Two different distortions, one channel, and neither one visible if you only run one report.
05 / Overall Channel Performance
Where the money goes, and THE TRUE COST OF A NEW CUSTOMER
Read the markup column top to bottom. Every single paid channel costs more per new customer than its blended CAC admits. There is no channel where the blended number is honest. The only question is how big the markup is, and the answer ranges from a rounding error on Meta to more than double on YouTube. If your growth model uses one CAC for the whole business, your model is built on the most flattering version of every channel simultaneously.
06 / New Customer Lifetime Value
What a new customer becomes over a year
Here is the fairness clause for YouTube. Its new customers start small at $84 and nearly triple to $244 by one year, still the steepest growth curve in the set, a pattern we covered in depth in Issue 008. That back-end value is real, but it does not erase an $826 nCAC. It means YouTube is a channel you evaluate on a payback window, not on week-one math, and definitely not on blended CAC. One caveat that applies to this whole grid: it blends brands at very different price points, so treat it as a directional market benchmark, not a promise for your store.
07 / Conclusion
One business, two CACs. Budget off the right one.
The blended CAC on your dashboard is answering a question you did not ask. You want to know what growth costs. It is telling you what activity costs, with your cheapest, most loyal buyers averaged in to make every channel look better than it is. Nine issues into this series, the markup between the two numbers has shown up every single week, on every paid channel, without exception.
The fix is not more reporting. It is verifying new versus repeat at the order level, pricing each channel by its true nCAC, and then making Scale, Chill, or Kill decisions off that number. Meta at a $88 nCAC and 87% new is a different decision than YouTube at $826 and 39% new, even though blended CAC says they are $77 and $319. Know which number you are looking at before you move the budget.
How this week's numbers were built. Aggregated across hundreds of Wicked Reports client accounts for the week of August 23 to August 29, 2026, except first click vs last click, which uses a rolling 90 day window. New versus repeat is verified at the order level against first party order IDs, not modeled and not surveyed. The new visit to new customer conversion rate credits the channel that originated the new visit. Channels without cost data, including email, SMS, organic, and influencer, are left out of the cost comparisons. Snapchat is excluded for negligible spend. Pinterest is marked with an asterisk because it ran on a small number of new customers this week, so it is not used to anchor any headline. The channel labeled Facebook in the underlying platform data is shown here as Meta. Charts and tables carry meaning through direction, labels, and contrast rather than color alone.
Topics: Wicked Reports New Customer Acquisition Cost (NCAC) Paid Traffic Truth YouTube Ads CAC Markup Blended CAC
9 min read
The Paid Traffic Truth : Why Your Priciest Ad Channel Grows the Fastest Customers
.png)
The Paid Traffic Truth — Issue 009
Published August 24,2026 * Data for the week of August 16 to August 22 2026 * Aggregated across hundreds of Wicked Reports accounts.
The Day Zero Trap: Your Priciest Channel Grows the Fastest Customers
Most operators judge a channel on what a customer spends the day they arrive. This week's data shows why that math quietly kills your fastest compounding channels. The customers who look worst on day zero are growing in value twice as fast as the ones who look best.
This week's number
A YouTube new customer nearly doubles in value in 30 days: $104 at first order, $199 by day 30, $235 at one year. Judge it on day zero and you miss more than half the value.
01 / Introduction
One story, four grids, hundreds of verified accounts
Every week I aggregate first party, order verified data across hundreds of eCommerce accounts and publish what the ad platforms will not show you. One story leads, and the same four grids follow: new customer acquisition, first click versus last click, overall channel performance, and new customer lifetime value. No modeled conversions, no surveys, no platform grading its own homework.
This week's story lives in the lifetime value grid. YouTube posts the ugliest new customer cost of any major paid channel, and it also grows the most valuable customer curve of any major paid channel. Both things are true at once, and if your measurement stops at day zero, you only ever see the first one.
02 / Analysis
Day zero revenue understates video customers by more than 2x
Here is the setup. A Meta new customer spends $64 on their first order. A YouTube new customer spends $104. On day zero, both look thin against their acquisition costs, and YouTube looks worst of all at a $478 nCAC. So the standard move is to kill the video spend and pour it back into whatever converts cheapest today. Now watch what happens after day zero.
A YouTube customer goes from $104 to $199 in 30 days. That is a 91% jump in one month, the steepest early payback curve of any channel with meaningful spend. By one year they are worth $235, a 2.26x multiple on their first order. TikTok shows the same shape at 2.29x. Meanwhile Meta, the cheap channel everyone trusts, grows its $64 first order to just $99, a 1.56x multiple, and Google manages only 1.36x. The channels that look worst on day zero compound the fastest. And to be clear about what the data does not say: even at one year, click credited revenue alone does not cover YouTube's $478 nCAC. That is the second half of the trap. The first versus last click grid below shows YouTube is under credited on last click, and none of these click based numbers count view driven purchases at all. Day zero math understates the customer by half, and click only credit understates the channel on top of it. Stack those two errors and killing video looks like discipline when it is actually a blind spot.
The honest read on this week: this is a structural pattern, not a calendar artifact. Video first channels acquire customers with lighter first orders that compound, and the shape holds across YouTube and TikTok in the same grid, in a plain late August week with no holiday selling event to distort it. Because this is aggregated across hundreds of accounts, no single brand's promotion can move these curves. What did move this week for calendar reasons is conversion rate, which dipped across most channels in typical late summer fashion. The LTV grid is built on a full year of cohort behavior, so the weekly dip does not touch the story.
03 / New Customer Acquisition
The full acquisition picture, by channel
Notice the pattern in the % new column. The expensive video channels bring in the freshest buyers: 79% of YouTube's customers and 81% of TikTok's are first timers, versus 65% on Google and 59% on Microsoft. Video is doing prospecting work. Search is, in large part, closing demand that already exists. Conversion rates softened across most channels this week, a normal late summer move, with YouTube's new visit to customer rate down 15% week over week.
04 / First Click vs Last Click
Who starts the sale vs who takes the bow
Same story it always tells, and this week it stacks on top of the LTV story. YouTube reads 0.49 on first click but only 0.42 on last click, because it starts journeys that search and email finish. Google and Microsoft read higher on last click than first, because they take the bow at the end of journeys someone else started. If your reporting is last click and day zero, video channels get penalized twice: once for starting sales they do not get credit for closing, and once for acquiring customers whose value has not shown up yet.
05 / Overall Channel Performance
Where the money goes, and THE TRUE COST OF A NEW CUSTOMER
Meta and Google together carry 91% of tracked spend, so the market has voted for cheap day zero acquisition. Fair enough. But look at the ROAS column with fresh eyes: the best weekly ROAS in the set belongs to Microsoft at 1.89, a channel where only 59% of buyers are new and last click over credits it by 0.46. High weekly ROAS keeps correlating with closing existing demand, not creating new customers. Cheap and compounding are different things, and this grid only shows you cheap.
06 / New Customer Lifetime Value
What a new customer becomes over a year
Sorted by growth multiple, the video and social channels own the top of this grid while search sits near the bottom. A Google customer arrives spending $164 and grows only 36% in a year. A YouTube customer arrives spending $104 and more than doubles. Pinterest posts the steepest multiple at 2.65x, but it runs on very little spend and very few new customers this week, so treat it as a footnote, not a finding. One standing caveat: this grid blends brands at different price points, so it is a directional market benchmark, not a promise for any one store.
07 / Conclusion
Stop grading a compounding asset on its opening day
Every channel in your account is being judged by a number, and for most operators that number is built from day zero revenue and last click credit. This week's data shows exactly which channels that math executes: the video channels acquiring your freshest customers with the fastest growing value curves. Nobody decides to kill their best prospecting engine. They just use a measuring stick that makes killing it look responsible.
The fix is not faith in video. It is measurement that follows the customer past day zero and past the last click. Know your real nCAC by channel, know what a new customer from each channel is worth at 30, 90, and 365 days, and make Scale, Chill, and Kill calls on that, not on a screenshot of week one ROAS. The channels compound. Your measurement should too.
How this week's numbers were built. Aggregated across hundreds of Wicked Reports client accounts for the week of August 16 to August 22, 2026, except first click vs last click, which uses a rolling 90 day window. New versus repeat is verified at the order level against first party order IDs, not modeled and not surveyed. The new visit to new customer conversion rate credits the channel that originated the new visit. Channels without cost data, including email, SMS, organic, and influencer, are left out of the cost comparisons. Snapchat is excluded for negligible spend. Pinterest is marked with an asterisk because it ran on a small number of new customers this week, so it is not used to anchor any headline. The channel labeled Facebook in the underlying platform data is shown here as Meta. Charts and tables carry meaning through direction, labels, and contrast rather than color alone.
Topics: Wicked Reports first click vs last click Paid Traffic Truth YouTube Ads paid traffic attribution new customer lifetime value
10 min read
The Paid Traffic Truth : Which Way Is Last-Click Attribution Wrong? One Direction
The Paid Traffic Truth — Issue 008
Published August 17,2026 * Data for the week of August 09 to August 15 2026 * Aggregated across hundreds of Wicked Reports accounts.
Last Click Moves Money in One Direction. Toward the Closer.
Everyone knows last click is imperfect. Almost nobody knows which direction it is wrong in. This week's verified data shows the error is not random noise. It runs one way, every time, and it decides which of your channels gets fed and which gets starved.
This week's number
On the same 90 day window, last click gives Google 12% more credit than first click (1.53 → 1.71 ROAS) while stripping 23% of Meta's (0.39 → 0.30). Same journeys. Opposite errors.
01 / Introduction
The error in your attribution is not random. It has a direction.
Every week I pull one story out of the same four grids: new customer acquisition, first click versus last click, overall channel performance, and new customer lifetime value. All of it is first-party, click-verified, and aggregated across hundreds of eCommerce accounts. No modeling, no surveys, no platform grading its own homework.
This week's story is the first versus last click grid, because it shows something most operators have never actually measured: which way last click lies. When you line up first click and last click ROAS for the same channels over the same 90 days, the shift is systematic. Credit flows away from the channels that open journeys and toward the channels that close them. If your budget decisions run on last click, you are not just working with imprecise numbers. You are working with numbers biased in a specific, predictable direction.
02 / Analysis
Same journeys, same window, opposite errors
Here is the comparison. First click asks "who started this sale?" Last click asks "who was standing there when it closed?" Both are looking at the exact same set of purchases. If attribution error were random, some weeks Google would gain credit under last click and some weeks it would lose it. That is not what happens. In this week's data, Google's ROAS reads 1.53 on first click and 1.71 on last click. Meta reads 0.39 on first click and 0.30 on last click. Last click hands Google a 12% raise and hands Meta a 23% pay cut, on the same customer journeys.
The pattern holds across the grid. Microsoft, a classic bottom-of-funnel search channel, gains the most:2.32on first click becomes2.79on last click, a 20% boost from the measurement method alone. YouTube, a discovery channel, loses 16%. The channels that introduce your brand to a stranger get their credit taken and handed to the channels that catch that same stranger a week later when they search for you by name. Now connect this to cost: Meta acquired new customers at$93nCAC this week versus Google's$143. The channel last click punishes is the cheaper place to buy a new customer. The channel last click flatters costs 54% more per new customer. If you rebalance budget on last click ROAS, you move money toward the expensive closer and away from the cheap opener, and your new customer growth stalls while your reported ROAS improves.
Is this a calendar artifact or a structural pattern? Structural. There is nothing special about a mid-August week, no holiday, no seasonal spike, and the direction of the credit shift matches how these channels function: search intercepts demand that already exists, social and video create it. Because the cause is the mechanics of the channels themselves, expect this same directional bias in your account next week and the week after, at whatever magnitude your mix produces. And because this data is aggregated across hundreds of accounts, no single brand's promotion can move these numbers. Pinterest is marked as a thin channel this week and is not used to anchor any conclusion here.
03 / New Customer Acquisition
The full acquisition picture, by channel
Look at the % new column next to the credit shift from section 02. Meta is 89% new customers, the highest share of any major paid channel, and it is the channel last click penalizes hardest. Microsoft is 58% new, the lowest, and it is the channel last click rewards most. The measurement method is systematically shifting credit from the channels doing your acquisition work to the channels harvesting demand that already existed. Meta's nCAC also improved about 4% week over week while its new-visit conversion ticked up, so the penalized channel got cheaper, not worse.
04 / First Click vs Last Click
Who starts the sale vs who takes the bow
This is the week's grid to sit with. Every search channel gains credit when you switch from first click to last click. Every social and video channel loses it. Six channels, one direction of error. If someone tells you last click is "close enough," ask them close enough in which direction, because the answer determines whether you are quietly starving the channels that bring you new customers.
05 / Overall Channel Performance
Where the money goes, and THE TRUE COST OF A NEW CUSTOMER
Meta and Google together carry about 91% of tracked spend, so those two rows are where budget decisions actually get made. Notice the shape: the channels with the best ROAS also carry the biggest nCAC markup over aCAC. Microsoft posts a 2.12 ROAS with a 72% markup, meaning a big share of that return is existing customers repurchasing. Meta posts the ugliest ROAS on the board and the cheapest verified new customer at $93 with only a 12% markup. ROAS and new customer efficiency are not the same metric, and this week they point in opposite directions.
06 / New Customer Lifetime Value
What a new customer becomes over a year
Meta's day 0 value is the lowest on the board at $63, growing 1.56x to $98 by one year. That matters for the story above: a channel that opens journeys with a small first order will always look terrible on a short-window last click ROAS, because most of its value shows up later and gets credited to whoever closed. One caveat that applies every week: this grid blends brands at very different price points, so treat it as a directional market benchmark, not a promise for any one store.
07 / Conclusion
Stop asking if last click is wrong. Ask which way it is wrong.
This week's data settles the direction question. Last click over-credits closers (Google +12%, Microsoft +20%) and under-credits openers (Meta −23%, YouTube −16%), on the same journeys over the same 90 days. It does this because of how the channels work, not because of anything on the calendar, which means it did it last week and it will do it next week, inside your account too.
The fix is not a better opinion. It is a better measurement layer: tie every order to the verified clicks that preceded it, separate new customers from repeat at the order level, and judge each channel by its actual job. Openers get judged on verified nCAC and what that customer becomes over a year. Closers get judged on efficiency capturing demand. When you do that, the $93 versus $143 comparison becomes the number you defend to finance, instead of a ROAS column that grades the closer's homework with the opener's work.
How this week's numbers were built. Aggregated across hundreds of Wicked Reports client accounts for the week of August 02 to August 08, 2026, except first click vs last click, which uses a rolling 90 day window. New versus repeat is verified at the order level against first party order IDs, not modeled and not surveyed. The new visit to new customer conversion rate credits the channel that originated the new visit. Channels without cost data, including email, SMS, organic, and influencer, are left out of the cost comparisons. Snapchat is excluded for negligible spend. Pinterest is marked with an asterisk because it ran on a small number of new customers this week, so it is not used to anchor any headline. The channel labeled Facebook in the underlying platform data is shown here as Meta. Charts and tables carry meaning through direction, labels, and contrast rather than color alone.
Topics: Wicked Reports New Customer Acquisition Cost (NCAC) last click attribution first click vs last click Paid Traffic Truth
10 min read
The Paid Traffic Truth : Why Last-Click Attribution Cuts Meta's ROAS and Pays Search
The Paid Traffic Truth — Issue 007
Published August 10,2026 * Data for the week of August 02 to August 08 2026 * Aggregated across hundreds of Wicked Reports accounts.
Last click cuts Meta’s return by 30% and pays it to search
I ran the same 90 days of verified orders through two attribution windows this week and got two different winners. On first click Meta returns 0.43 and Google returns 1.54. On last click Meta drops to 0.30 and Google climbs to 1.72. If your budget meeting uses the second number, you are about to defund the channel that started the sales you are celebrating.
This week's number
Move from first click to last click and Meta’s ROAS falls 30%, while Google’s rises 12% and Microsoft’s rises 22%. Same orders, same revenue, same 90 days. Only the credit moved.
01 / Introduction
Two attribution windows, two different winners, one set of orders
Every week I pull new customer economics from hundreds of Wicked Reports accounts, verified at the order level against first party order IDs. Not modeled. Not surveyed. This week the interesting number is not a performance number at all. It is an accounting number.
Below you get the story first, then the four grids: new customer acquisition, first click versus last click, overall channel performance, and new customer lifetime value. The story this week is what happens to your channel ranking when you change nothing except which click gets the credit.
02 / Analysis
Nobody performed differently. The credit moved.
Take every order in the trailing 90 days and give 100% of the revenue to the first click that touched it. Then run it again and give 100% to the last click. Same orders, same revenue, same spend in the denominator. The only thing that changes is who gets paid on paper. Here is what that swap does to each channel, with every channel indexed to its own first click result so you can see the direction rather than the absolute level.
Meta loses 30% of its measured return on the switch. Google gains 12% and Microsoft gains 22%. YouTube loses 16%. The pattern is not random and it is not about ad quality. Social channels get found early in a buying decision, and search gets typed in at the end, so a last click model quietly hands social’s work to search and calls it search performance. The acquisition grid says the same thing from the other direction: 90% of Meta’s customers this week were brand new, against 66% on Google and 58% on Microsoft. The channel bringing you the most first time buyers is the channel last click punishes hardest.
Is this a calendar effect? The first week of August is a quiet stretch, past the July promo cycle and not yet into back to school and Labor Day, so a soft social week would be an easy explanation. I do not think that is what this is. The first click versus last click comparison runs on a rolling 90 day window, not on the week, and the direction of the gap has been consistent: prospecting channels open sales and search closes them. That makes it structural, and structural means it will be true again next week. The number I would treat as genuinely calendar sensitive is Google’s nCAC, up 12% week over week to $148, with the click price up about 5% and new customer conversion down about 4%. That is a mix and auction move worth watching, not a verdict.
03 / New Customer Acquisition
The full acquisition picture, by channel
Read the last two columns together. Meta converts new visits to new customers at 2.5% and delivers new customers at $96, and 90% of what it delivers is a first time buyer. Google converts at 2.3% but a new customer costs $148, and a third of its customers were already yours. Microsoft is the most expensive new customer in the set at $160 and the least new at 58%. YouTube and TikTok are prospecting channels that are honest about it: 82% and 77% new, at $395 and $344. Pinterest is marked with an asterisk because it produced very few new customers this week, so its rates swing wildly and it anchors nothing in this issue.
04 / First Click vs Last Click
Who starts the sale vs who takes the bow
The credit gap column is last click minus first click. Negative means the channel starts sales it does not get paid for. Meta and YouTube are both under credited, Google and Microsoft are both over credited, and TikTok is close to even. Microsoft has the widest single gap at 0.56, which is a good reminder that a 3.07 ROAS on a closing channel is not the same claim as a 3.07 ROAS on a channel that found the customer. If you only ever look at one of these two columns, you are not measuring performance, you are choosing a winner in advance.
05 / Overall Channel Performance
Where the money goes, and THE TRUE COST OF A NEW CUSTOMER
Meta carries 55% of tracked spend and posts the weakest headline ROAS of the two big channels at 0.51, and yet it produces the cheapest new customer in the set at $96, only 12% above its blended aCAC. Google is the reverse: a 1.44 ROAS, and a new customer that costs 49% more than its blended number suggests. Microsoft is the sharpest version of the trap, a 2.25 ROAS sitting on a 72% nCAC markup. Note that the ROAS in this grid is the weekly full funnel figure, which is a different measure from the 90 day first and last click columns in section 04. Compare them for direction, not level.
06 / New Customer Lifetime Value
What a new customer becomes over a year
This grid blends brands at very different price points, so treat it as a directional market benchmark rather than a promise for your store. The line I would stare at is Meta: a new customer worth $63 on the first order and $97 after a year, against a $96 nCAC. In aggregate, Meta new customers take a full year to pay back the cost of acquiring them, on revenue, before margin. Google new customers start at $160 and reach $219, so they cover a $148 nCAC much faster. That is the real trade behind the credit argument, and it is why I want both attribution views before I move budget rather than after.
07 / Conclusion
Pick your attribution window before you pick your winner
Nothing in this week’s data says Meta is good and Google is bad. It says the ranking of your channels is partly a choice you already made when you picked an attribution model, and most teams made that choice by accident, by using whatever the ad platform reported. Judge on last click and you will cut the channel that opens sales in order to fund the channel that closes them. Do that for two quarters and the closer runs out of people to close.
The practical fix is small. Put first click and last click side by side, then buy on nCAC and nLTV rather than on either ROAS number alone. This week that means Meta is the cheapest source of first time buyers you have, with a payback period of about a year that you need to underwrite deliberately, and Google is an efficient closer that is being credited for demand it did not create. Both facts are true at once, and you can only see both if you refuse to let one model do all the talking.
How this week's numbers were built. Aggregated across hundreds of Wicked Reports client accounts for the week of August 02 to August 08, 2026, except first click vs last click, which uses a rolling 90 day window. New versus repeat is verified at the order level against first party order IDs, not modeled and not surveyed. The new visit to new customer conversion rate credits the channel that originated the new visit. Channels without cost data, including email, SMS, organic, and influencer, are left out of the cost comparisons. Snapchat is excluded for negligible spend. Pinterest is marked with an asterisk because it ran on a small number of new customers this week, so it is not used to anchor any headline. The channel labeled Facebook in the underlying platform data is shown here as Meta. Charts and tables carry meaning through direction, labels, and contrast rather than color alone.
Topics: Wicked Reports New Customer Acquisition Cost (NCAC) Attribution Window Return on Ad Spend (ROAS) first click vs last click Paid Traffic Truth
10 min read
The Paid Traffic Truth : Why Your Best ROAS Channels Bring the Fewest New Customers
.png)
The Paid Traffic Truth — Issue 005
Published August 03,2026 * Data for the week of July 26 to August 01 2026 * Aggregated across hundreds of Wicked Reports accounts.
WhyYour Best ROAS Channels Bring the Fewest New Customers
A calm week, which is the best time to see a structural truth clearly. Sort your channels by ROAS this week and watch the share of customers who are actually new fall as you climb the list. The channels posting the best returns are the ones doing the least to grow your customer base.
This week's number
Google's ROAS is 3x Meta's, yet 89% of Meta's customers are brand new against 68% of Google's. Microsoft posts the best ROAS in the set at 2.76 and the lowest new share at 59%. The better the ROAS, the more of it is repeat business.
01 / Introduction
A quiet week, and two things that settled down
Welcome to the sixth edition of the Paid Traffic Truth. This was a quiet week, and I am not going to dress it up. Two things I flagged recently both settled in the calm direction. Meta's late July cost bump leveled off, with new customer conversion ticking back up a touch, which is what you would expect if that was a seasonal dip rather than a real problem. And Microsoft's ROAS, which had slipped three weeks running, bounced back this week.
With no fire to put out, a quiet week is the right time to look at something that is always true but easy to miss when a number is jumping around. It sits in plain sight in this week's grids. Every figure is first party and order verified, aggregated across hundreds of ecommerce brands.
02 / Analysis
Rank by ROAS and the new-customer share runs the other way
Take this week's channels and line them up by ROAS, best to worst. Microsoft leads at 2.76, then Google at 1.54, then the video and social channels trail with Meta at 0.51 and TikTok at 0.27. Standard picture. Now add one column next to it: the share of each channel's customers who are actually new to the brand.
The two columns point in opposite directions. Microsoft, the ROAS leader, is only 59% new. Google is 68% new. Meta, near the bottom on ROAS, is 89% new. YouTube is 85%. The higher a channel sits on ROAS, the smaller the fraction of its customers who are people you did not already have.
This is not a coincidence, it is how the metric is built. A channel like Google or Microsoft captures a lot of demand at the moment of purchase, and a good chunk of that demand is existing customers coming back to buy again. Those repeat orders are cheap to win and they land in the channel's revenue, so its ROAS looks strong. Meta and the video channels spend most of their effort in front of people who have never bought from you, which is harder and converts lower, so their ROAS looks weak even though they are doing the actual work of growing the business.
Put plainly, ROAS quietly rewards a channel for reselling to people you already have. The two dominant channels this week make the point on their own. Google's ROAS is three times Meta's, but roughly a third of Google's customers are repeat buyers, against barely one in ten on Meta. If you shift budget toward the higher ROAS number, you are partly paying to harvest demand you would likely have captured anyway, and starving the channel bringing in new humans.
The honest caveat, because this cuts both ways. A high repeat share is not a sin, closing existing demand efficiently is a real job and someone has to do it. The point is not that Google is bad and Meta is good. It is that ROAS alone cannot tell you which job a channel is doing, and if growth is your goal, the share of new customers belongs right next to the ROAS number, not three columns away. This is a quiet, no-drama week across the board, so read this as a standing structural feature of the data, not a one-week event.
03 / New Customer Acquisition
The full acquisition picture, by channel
Sorted by new share this time, so the pattern from the chart reads top to bottom. Meta and the video channels sit up top doing the prospecting, and by the time you reach the bottom of the list you are looking at the channels with the strongest ROAS. Meta held steady with conversion up a couple of points, the leveling off mentioned earlier. YouTube and TikTok conversion slipped on small volume, so treat those as wobbles. Pinterest ran thin again and carries an asterisk.
04 / First Click vs Last Click
Who starts the sale vs who takes the bow
This grid reinforces the same idea from a different direction. The channels that close, Google and Microsoft, gain ROAS on the last click model, the one closest to what platforms report. The channels that open, Meta and Pinterest, lose it. So the channel doing the most new customer work is also the one most likely to be under credited when you look at platform numbers. Two ways of measuring, same conclusion about who gets shortchanged.
05 / Overall Channel Performance
Where the money goes, and THE TRUE COST OF A NEW CUSTOMER
The markup column tells the same story a third way. Look at where the gap between blended cost and true new customer cost is widest. Microsoft at 69% and Google at 47%. Those are the high ROAS channels, and the wide gap is the tell that a lot of their cheap blended cost is repeat business. Meta's markup is just 12%, because almost everyone it brings in is new, so its blended and new customer costs are nearly the same number. Microsoft's ROAS rebound to 2.76 this week is worth noting after three down weeks, though at 2.4% of spend it does not move the overall picture.
06 / New Customer Lifetime Value
What a new customer becomes over a year
The value grid adds the missing dimension to the whole discussion. A new customer is worth roughly one and a half times their first order within a year on most channels, and more than double on TikTok and Pinterest. That value only accrues if you keep acquiring new customers, which loops right back to the point. The channels earning the applause on ROAS are not the ones filling this table with new names. As always, this blends hundreds of brands at different price points, so treat it as a directional benchmark, not a promise for your store.
07 / Conclusion
ROAS answers a question you did not ask
ROAS tells you how much revenue a channel returned per dollar spent. It does not tell you how many new customers that dollar bought, and this week it quietly told you the opposite, because the highest returns came from the channels doing the least prospecting. On a loud week that is easy to miss. On a quiet week like this one it is sitting right there in the grids.
If growth is the goal, the share of new customers and the verified cost to acquire them belong next to ROAS, not buried three columns over. Watch all three together and you stop mistaking efficient reselling for growth.
How this week's numbers were built. Aggregated across hundreds of Wicked Reports client accounts for the week of July 26 to August 01, 2026, except first click vs last click, which uses a rolling 90 day window. New versus repeat is verified at the order level against first party order IDs, not modeled and not surveyed. The new visit to new customer conversion rate credits the channel that originated the new visit. Channels without cost data, including email, SMS, organic, and influencer, are left out of the cost comparisons. Snapchat is excluded for negligible spend. Pinterest is marked with an asterisk because it ran on a small number of new customers this week, so it is not used to anchor any headline. The channel labeled Facebook in the underlying platform data is shown here as Meta. Charts and tables carry meaning through direction, labels, and contrast rather than color alone.