

10 min read
The Paid Traffic Truth : The Q4 Ad Ramp Just Hit. Meta Crossed $100.
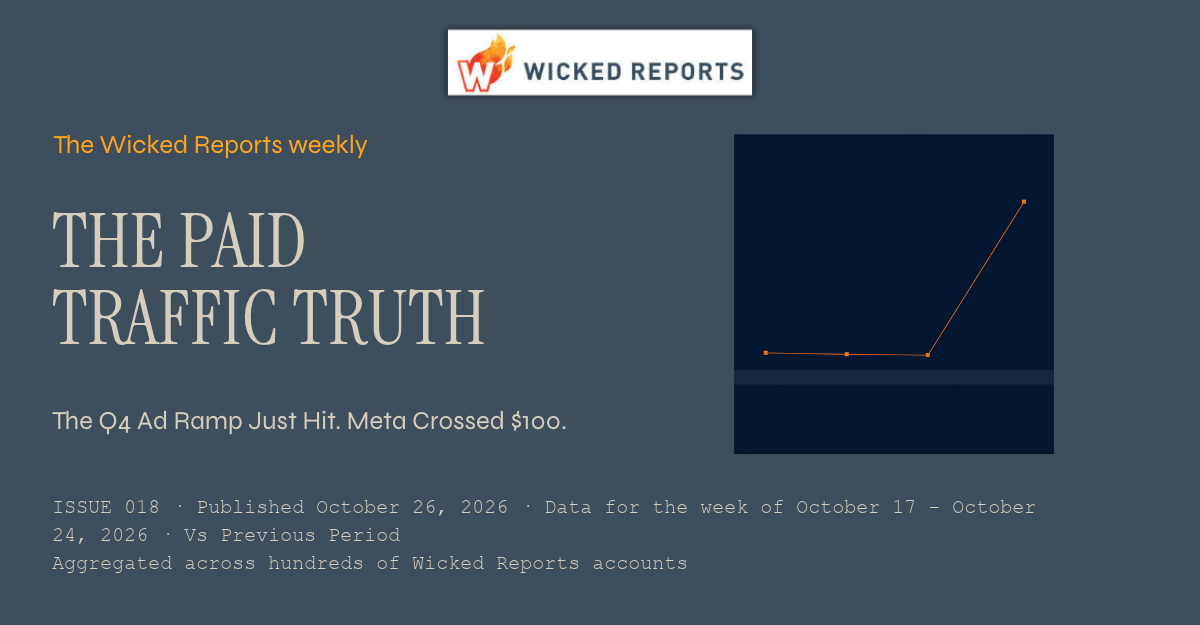
The Paid Traffic Truth — Issue 018
Published October 19,2026 * Data for the week of October 18 to October 24 2026 * Aggregated across hundreds of Wicked Reports accounts.
For three weeks October traded quietly while everyone braced for the Q4 spend ramp. This week it arrived. Meta's verified new customer cost jumped 25% in a single week, click prices inflated across the biggest auctions, and the question this series has been preparing you for is now live in every weekly meeting: how much of this is the season, and how much is you?
This week's number
Meta's verified nCAC jumped 25% in one week to $100, its first triple-digit week in this series, on click prices up 12% and conversion down 9%.
01 / Introduction
The event you baselined for is here.
Since the start of October this series has carried the same advice: write down your verified September numbers, because when the Q4 ramp hits, that baseline is the only way to tell seasonal inflation from account trouble. This week the ramp hit. Spend in the data set rose, costs rose faster, and the biggest channel absorbed the biggest shock.
This issue covers what moved, why the shape of the move says it is the season rather than a platform problem, and how to run the seasonal-or-me test on your own account. Then the same four verified grids as every week: new customer acquisition, first click versus last click, overall channel performance, and new customer lifetime value. All first-party, order-verified data aggregated across hundreds of Wicked Reports accounts. No modeling, no surveys.
02 / Analysis
A 25% jump with a seasonal signature.
Meta went from roughly $80 to $100 per verified new customer in one week. Two things moved at once to produce that, and the combination is the tell. Click prices rose 12%, which is auction pressure: more BFCM-minded advertisers bidding into the same inventory. And conversion fell 9%, which is shopper behavior: late-October traffic browses, builds carts, and waits for the deals it knows are coming. Price up and intent down at the same time is the signature of a seasonal ramp, not of broken creative or a misfiring account.
The move was not Meta alone, and the pattern across channels backs the seasonal read. Google rose 8% to $171 on the same shape, click prices up and conversion down. YouTube rose 16% to $448. Spend rotated toward Meta at the same time, its share climbing to 54.8% of tracked spend while Google's slipped to 34.7%, which is what budgets always do as BFCM approaches: discovery channels get loaded first. More dollars chasing feeds plus lower-intent browsing is the whole mechanism, and it will intensify from here through Black Friday.
The quality side held better than the cost side. Meta's new-buyer share dipped from 92% to 89%, still the highest of any major channel, with a markup over blended CAC of 12%. So the customers are still real and still new. They are just more expensive this month, and the market-level answer to the question everyone asks in a week like this is: yes, it is the season. A roughly 25% jump on Meta and 8% on Google is what the ramp costs at market level this week. Your account's jump should be compared against those numbers, not against zero.
03 / New Customer Acquisition
The full acquisition picture, by channel
Two things to handle with care in this grid. TikTok posted its biggest verified volume ever in this series at an $85 nCAC, cheaper than Meta this week, but look at the rest of its row before moving money: a 93% markup over blended CAC, only 52% new buyers, conversion down 66%, and click prices that fell by more than half in seven days. A channel whose every input swings that violently week to week is not priced, it is oscillating, and this series has watched it whipsaw in both directions for two months. The other: Microsoft was the only major channel to get cheaper this week, down to $177 with conversion up 5%, easing back after its October climb.
04 / First Click vs Last Click
Two models, two different weeks
A measurement note that matters more every week from now through December. Ramp-season journeys stretch: the click happens in late October and the purchase lands around Black Friday. Last click will book that November sale to whatever closed it, usually an email or a branded search, while the October prospecting click that started it carries the cost with none of the credit. When you review this month's spend in your own reporting, make sure the model you are reading answers the question you are asking.
05 / Overall Channel Performance
Where the money goes, and THE TRUE COST OF A NEW CUSTOMER
The spend rotation is the quiet story in this grid. Meta absorbed over half of all tracked spend this week while Google's share fell under 35%, and the money moved just as the price of a Meta customer jumped. That is not a contradiction, it is the Q4 trade: brands load the discovery channel that fills carts in October and accept this month's inflated nCAC to own the audiences they will convert in November. The ROAS column will punish them for it all month. The LTV grid below is where that trade either pays or does not.
06 / New Customer Lifetime Value
What a new customer becomes over a year
Here is the tension the ramp creates, in one pair of numbers. A Meta new customer is worth $114 at one year on click-credited revenue, and this week it cost $100. September's comfortable spread is down to $14 at market level, and it will compress further as the ramp builds. That does not make October Meta spend wrong. It makes it a bet that the customers acquired now return in Q4's heavy buying weeks, which is historically exactly what they do, and it means the brands that win November are the ones judging this month's spend on customer value rather than this month's revenue. The standing caveat applies: this grid blends brands at very different price points, so treat it as a directional market benchmark, not a promise for any one store.
07 / Conclusion
Run the seasonal-or-me test
The test this series has been setting up all month is now live, and it takes ten minutes. Pull your verified Meta and Google nCAC for last week and compare each against your September baseline. The market's answer this week: Meta up roughly 25%, Google up roughly 8%. If your increases are in that neighborhood, you are paying the same seasonal premium as everyone else, and the right response is to hold your plan, not to start killing campaigns. If your Meta is up 60% while the market paid 25%, the season is not your problem, and the gap between your number and the market's is the size of it.
And check the quality column while you are in there. The market's new-buyer share barely moved this week, which means the inflated prices are still buying real growth. If your costs jumped and your new-buyer share dropped at the same time, that is the combination worth a hard look before BFCM, because it means you are paying ramp prices for repeat customers who were coming back anyway.
See your own version of these four grids.
Your real nCAC next to your aCAC, your first versus last click gap, your new customer LTV by channel, in your own account.
Get the Paid Traffic Truth Report directly to your inbox.
How this week's numbers were built. Aggregated across hundreds of Wicked Reports client accounts for the week of October 18 to October 24, 2026, except first click vs last click, which uses a rolling 90 day window. New versus repeat is verified at the order level against first party order IDs, not modeled and not surveyed. The new visit to new customer conversion rate credits the channel that originated the new visit. Channels without cost data, including email, SMS, organic, and influencer, are left out of the cost comparisons. Snapchat is excluded for negligible spend. Pinterest is marked with an asterisk because it ran on a small number of new customers this week, so it is not used to anchor any headline. The channel labeled Facebook in the underlying platform data is shown here as Meta. Charts and tables carry meaning through direction, labels, and contrast rather than color alone.