

5 min read
Custom Analysis Deep Dive: Your Weekly Report in One Click
.png)
Every marketer I know has a report they rebuild constantly. Same channels, same metrics, same comparison to last week, reassembled by hand every Monday morning.
And when AI tools promise to fix this, they usually make it worse. You wire an LLM to your platform data, it answers fluently from numbers that grade their own homework, and now you have a fast version of the wrong answer.
We built Analyst to solve the first half of this: real questions, answered from your verified Wicked Reports account data through our MCP server. Usage has been strong, both through Analyst and through the MCP directly. But Analyst launched with the most commonly asked questions, and your weekly reporting isn't common. It's yours.
Custom Analysis closes that gap. You can now write your own questions, save them to your account, and get your exact analysis back in one click.
Topics: Wicked Reports Deterministic AI Customer Marketing Reports nCAC Weekly Report AI Marketing Analyst
9 min read
The Paid Traffic Truth : YouTube new customers nearly triple in value in 30 days
-1.png)
The Paid Traffic Truth — Issue 017
Published October 19,2026 * Data for the week of October 11 to October 17 2026 * Aggregated across hundreds of Wicked Reports accounts.
Every week someone cuts a channel because the first seven days looked bad. This week the data shows exactly what that costs. The channel with the ugliest week-one numbers in the set is also the one whose customers grow fastest after they buy.
This week's number
A YouTube new customer is worth $87 on day 0 and $239 within 30 days, climbing to $266 by one year. That is a 3.06x multiple, the steepest of any channel with real volume.
01 / Introduction
The week-one yardstick kills the wrong channels
Here's the trap. You judge every channel on the same clock: what did it return this week. Some channels run on that clock. Search converts demand that already existed, so its results show up fast. Other channels create customers who start small and grow, and on a seven day clock they always look like losers.
This week's four grids, verified at the order level across hundreds of eCommerce brands, show the trap in full. YouTube posts the kind of week-one numbers that get budgets pulled. Then the lifetime value grid shows what those same buyers are worth a month later, and the verdict flips.
02 / Analysis
$87 on day 0. $239 by day 30.
On the week grid, YouTube reads $380 nCAC and 0.61 ROAS. Judged on day-0 math, it's the first budget to cut. But watch what its buyers do after the first order. The average YouTube new customer comes in at $87, the second smallest first order in the set, and is worth $239 within 30 days. That's nearly triple, in one month, while most channels take a year to grow half that much.
Compare the curves. Google new customers start at $189 and finish the year at $245, a 1.30x climb. Meta starts at $75 and reaches $110, 1.47x. YouTube starts below both of them in dollar terms and finishes above Meta's one-year value within 30 days. The channel converts slowly, 0.4% of new visits become customers against Meta's 2.7%, and the buyers it does convert compound faster than anyone's. YouTube is also 79% new customers, so this growth is coming from genuinely new buyers, not repeat purchasers wearing a new label.
One honest note before you reweight anything. The lifetime value grid is built on trailing cohorts, so this is a structural pattern, not a one-week move. Nothing about Oct 11 to 17 created it, and it will not vanish next Monday. The caveat runs the other way: these curves blend hundreds of brands at different price points, and part of YouTube's steep climb likely reflects the mix of brands that lean on it, including subscription-heavy stores whose buyers rebill. Treat the multiple as a directional market benchmark, not a promise for your store. Your own curve is the one that matters, and it is knowable.
03 / New Customer Acquisition
The full acquisition picture, by channel
Meta remains the volume machine: 92% of its buyers are new, at a $79 nCAC, with conversion ticking up again this week. The row to study is YouTube. It converts just 0.4% of new visits, a slow channel by construction, which is exactly why a week-one verdict reads it wrong. Slow conversion plus fast post-purchase growth is the signature of a channel that builds demand instead of harvesting it.
04 / First Click vs Last Click
Who starts the sale vs who takes the bow
This grid is a measurement check, not an investment case. The pattern holds again this week: channels that close journeys read better the closer the yardstick sits to the finish line, and channels that start journeys read better at the starting line. YouTube is under credited even between two click models, which fits everything else in this issue: its value shows up late, after the click, after the first order, on the grid below.
05 / Overall Channel Performance
Where the money goes, and THE TRUE COST OF A NEW CUSTOMER
Meta and Google still carry 89% of tracked spend. Note the markups: a Google new customer costs 57% more than its blended CAC suggests, Microsoft runs 73%. And there sits YouTube at $380 nCAC and 0.61 ROAS, the row every week-one budget review wants to cut. Hold that number against the grid below before you do.
06 / New Customer Lifetime Value
What a new customer becomes over a year
Pinterest technically posts the steepest multiple at 3.61x, but it acquired very few new customers this week, so it anchors nothing. YouTube is the story: real volume, and nearly the entire climb lands inside the first 30 days. $87 to $239 in a month, then a slow coast to $266. If your evaluation window for YouTube is shorter than 30 days, you are grading it before its revenue arrives. One standing caveat: this grid blends brands at different price points, so treat it as a directional market benchmark, not a promise for any one store.
07 / Conclusion
Judge every channel on the clock it actually runs on
Search channels run on a fast clock. Demand already exists, the click closes it, the revenue lands this week. Judging them on week-one math is fair. Video channels run on a slow clock. The buyer arrives small and grows, and the revenue lands on day 25, not day 2. Judging them on week-one math defunds your fastest-compounding customers.
So before this week's budget meeting, ask one question of every channel on the chopping block: what is a new customer from this channel worth in 30 days, not on day 0. If you can't answer from verified order data, that's the gap. The channels that deserve cutting and the channels that deserve patience look identical until you can.
See your own version of these four grids.
Your real nCAC next to your aCAC, your first versus last click gap, your new customer LTV by channel, in your own account.
Get the Paid Traffic Truth Report directly to your inbox.
How this week's numbers were built. Aggregated across hundreds of Wicked Reports client accounts for the week of October 11 to October 17, 2026, except first click vs last click, which uses a rolling 90 day window. New versus repeat is verified at the order level against first party order IDs, not modeled and not surveyed. The new visit to new customer conversion rate credits the channel that originated the new visit. Channels without cost data, including email, SMS, organic, and influencer, are left out of the cost comparisons. Snapchat is excluded for negligible spend. Pinterest is marked with an asterisk because it ran on a small number of new customers this week, so it is not used to anchor any headline. The channel labeled Facebook in the underlying platform data is shown here as Meta. Charts and tables carry meaning through direction, labels, and contrast rather than color alone.
Topics: Wicked Reports New Customer Acquisition Cost (NCAC) Paid Traffic Truth YouTube Ads new customer lifetime value day zero revenue customer value curve
9 min read
Wicked Reports 2.0 October Release: 6 New Features
.png)
New in Wicked Reports 2.0 : More credit for the ads that start the journey, not just the ones that finish it.
Topics: Wicked Reports Wicked Reports 2.0 TikTok Shop Attribution GMV Max Attribution Conversion Timing
6 min read
Halo Modeling Deep Dive: Credit for Views, Not Just Clicks

Maybe you've had this experience. You run ads across multiple channels, and a big share of the budget goes to video: TikTok, YouTube, Meta video at the top of funnel.
People don't click those ads much. They watch, then later they open Google and search your brand name. The click attribution goes to whatever got clicked last: Google brand, Microsoft brand, organic search, or in the worst case the order comes through completely unattributed.
The video that actually started the sale gets no credit. But you know it's working, because when you stop running those campaigns, revenue drops. When you scale them, it climbs. The clicks just never told that story.
Halo Modeling resolves that conflict. It gives credit back to the channels that earn attention but don't collect clicks, and unlike every black-box approach out there, it shows you exactly how.
Topics: Wicked Reports New Customer Acquisition Cost (NCAC) Halo Effect Halo Effect Attribution View Through Attribution
10 min read
The Paid Traffic Truth : The Calm Week Before the Q4 Ramp
.png)
The Paid Traffic Truth — Issue 016
Published October 12,2026 * Data for the week of October 04 to October 10 2026 * Aggregated across hundreds of Wicked Reports accounts.
The Calm Week Before the Q4 Ramp
The first full week of Q4 came in quiet. The two giants are sitting within a few dollars of their September close, click prices have not started climbing, and the baseline numbers from last issue are still the baseline. One channel did not get the memo: Microsoft's new customer cost has now risen four weeks in a row.
This week's number
Meta held at $78 with 92% verified new buyers, its highest new share on record in this series, and its tightest markup over blended CAC at 8%. Google held at $163. The ramp has not arrived.
01 / Introduction
Quiet tape, one exception
Last issue closed out September and said the next structural event on the calendar was the Q4 spend ramp. This week's data says it has not started. Meta moved 1%, Google moved 2%, Meta's click prices actually fell 5%, and the auction pressure everyone is bracing for is still ahead. Quiet weeks are useful precisely because nothing is distorting the numbers.
The exception is Microsoft, covered below, followed by the same four verified grids as every week: new customer acquisition, first click versus last click, overall channel performance, and new customer lifetime value. All first-party, order-verified data aggregated across hundreds of Wicked Reports accounts. No modeling, no surveys.
02 / Analysis
Three lines, one mover
Here are the three largest paid channels over the last four weeks. Two of them are the picture of stability. One is not.
The stability is the headline, even if it does not feel like one. Meta's $78 comes with its strongest quality profile in this series: 92% of its tracked customers verified as first-time buyers and a markup over blended CAC of just 8%, meaning the number you see is almost entirely the cost of real growth. Google's $163 sits three dollars off its September close with conversion flat. Click prices are not climbing anywhere that matters yet. If you took last issue's advice and wrote down your baseline, nothing this week invalidated it, and if you did not, this is the last quiet tape you are likely to get before the ramp.
Microsoft is the counter-trend. Four straight weekly increases, $170 to $207, a 22% climb over the stretch, while its new-buyer share slid from 58% to 55% and its markup over blended CAC hit 80%, the highest of any major channel. The mechanism is murky: this week its click prices fell 4% while conversion dropped 6%, so the deterioration is in what the traffic does, not what it costs. Two honest qualifiers before anyone touches a budget. Microsoft carries 3.4% of tracked spend, so a smaller pool of accounts moves this aggregate more easily than it could on Meta or Google. And four weeks of drift in a small channel is a watch item, not a verdict. If you spend on Microsoft, the move is to pull your own verified number, not to react to the market's.
03 / New Customer Acquisition
The full acquisition picture, by channel
Beyond the headliners: YouTube keeps holding its new range, back down to $366 this week with conversion up 14% and a growing spend share at 4.3%. Five weeks ago that channel cost roughly $630 per new customer, and the reset has now held long enough to treat the low $400s and below as its current level. TikTok swung violently upward this week, which means nothing, exactly as its downward swing meant nothing last week. The AI assistant channel had a soft conversion week but remains one of the highest new-buyer shares in the set at 79%.
04 / First Click vs Last Click
Two models, two different weeks
One measurement note worth connecting to the Microsoft story above. Microsoft's last-click over-credit widened to 0.61 this week, its largest in this series, at the same time its verified new customer cost hit a four-week high. A last-click dashboard shows that channel improving while the verified grid shows it deteriorating. That is not a contradiction, it is two models answering different questions, and only one of them is pricing new customers.
05 / Overall Channel Performance
Where the money goes, and THE TRUE COST OF A NEW CUSTOMER
The Microsoft row is this grid's cautionary tale this week. It posts the best ROAS in the set at 1.70, and it carries an 80% markup between blended CAC and true new customer cost, which means most of what that ROAS is celebrating is repeat demand. A channel can look like your best performer and be your most expensive source of actual growth at the same time. Meta remains the inverse: the worst-looking ROAS at 0.55 and the cheapest verified new customer at $78.
06 / New Customer Lifetime Value
What a new customer becomes over a year
The value side gives Microsoft its fair hearing. A Microsoft new customer is the most valuable paid acquisition in the set at $373 over a year, so even at $207 the channel still pays back on its own click-credited revenue. The four-week climb has not broken its economics, it has thinned them: the spread between one-year value and acquisition cost has narrowed from roughly $195 a month ago to $166 now. The standing caveat applies: this grid blends brands at very different price points, so treat it as a directional market benchmark, not a promise for any one store.
07 / Conclusion
Use the quiet. It will not last.
The market enters mid October with the big baselines intact: Meta near $78 at the strongest new-buyer quality this series has recorded, Google near $163, YouTube settled at roughly half its summer cost, and Microsoft drifting the wrong way on thin volume. BFCM is about seven weeks out, and the auction pressure that will define November has not shown up in click prices yet.
If you recorded your baseline last week, verify it held and move on. If you did not, do it now, because every week from here adds ramp noise to the numbers you are trying to call normal. And if Microsoft is in your mix, pull your own verified nCAC and new-buyer share for the last four weeks specifically. The aggregate says that channel is getting more expensive while looking better on ROAS, and that combination is exactly how a line item earns budget it no longer deserves.
See your own version of these four grids.
Your real nCAC next to your aCAC, your first versus last click gap, your new customer LTV by channel, in your own account.
Get the Paid Traffic Truth Report directly to your inbox.
How this week's numbers were built. Aggregated across hundreds of Wicked Reports client accounts for the week of October 04 to October 10, 2026, except first click vs last click, which uses a rolling 90 day window. New versus repeat is verified at the order level against first party order IDs, not modeled and not surveyed. The new visit to new customer conversion rate credits the channel that originated the new visit. Channels without cost data, including email, SMS, organic, and influencer, are left out of the cost comparisons. Snapchat is excluded for negligible spend. Pinterest is marked with an asterisk because it ran on a small number of new customers this week, so it is not used to anchor any headline. The channel labeled Facebook in the underlying platform data is shown here as Meta. Charts and tables carry meaning through direction, labels, and contrast rather than color alone.
Topics: Wicked Reports New Customer Acquisition Cost (NCAC) Paid Traffic Truth paid media measurement BFCM Q4 Budget Planning Microsoft Ads
4 min read
New customer costs fell $55. Meta missed it.
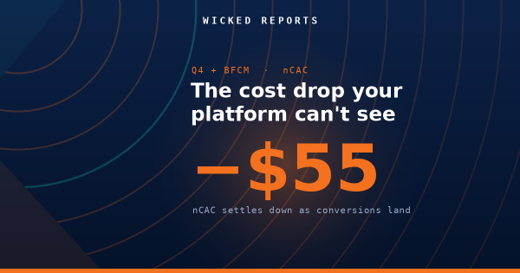
How much does new customer CAC fall after the click month?
New customer acquisition cost is supposed to be a number you can trust on the day you read it. In Q4 it is not, and the size of the gap is the whole story.
Topics: Wicked Reports New Customer Acquisition Cost (NCAC) blended ROAS BFCM Delayed Conversions Meta CAC BFCM
4 min read
The sooner you buy Meta clicks, the more you make
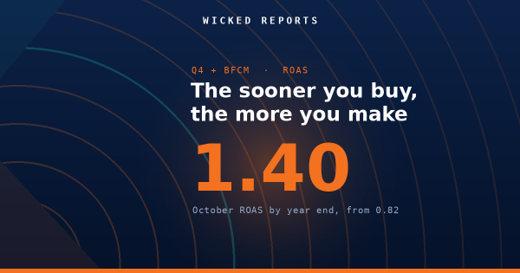
When is the best time to buy Meta clicks in Q4?
If there is one line to plan Q4 around, it is this : the sooner you buy the click, the more money it makes by the time the year closes.
Topics: Wicked Reports meta roas BFCM BFCM ROAS When To Buy Meta Clicks
3 min read
Is the 49% BFCM click premium worth it?
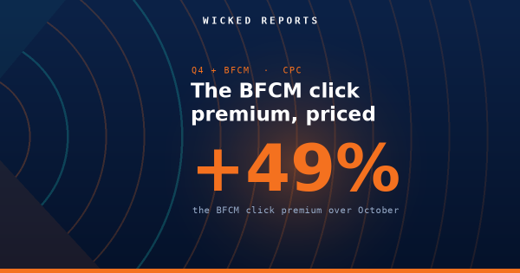
How much more do Meta clicks cost on BFCM?
Every Q4 you watch your Meta cost per click climb, and every Q4 you wonder whether the BFCM premium is worth paying. Here is the 2025 answer, with the numbers.
Topics: Wicked Reports BFCM BFCM CPC Meta CPC BFCM Ad Premium CPC vs CAC
10 min read
The Paid Traffic Truth : Paid Traffic Enters Q4 Cheaper Than It Left August
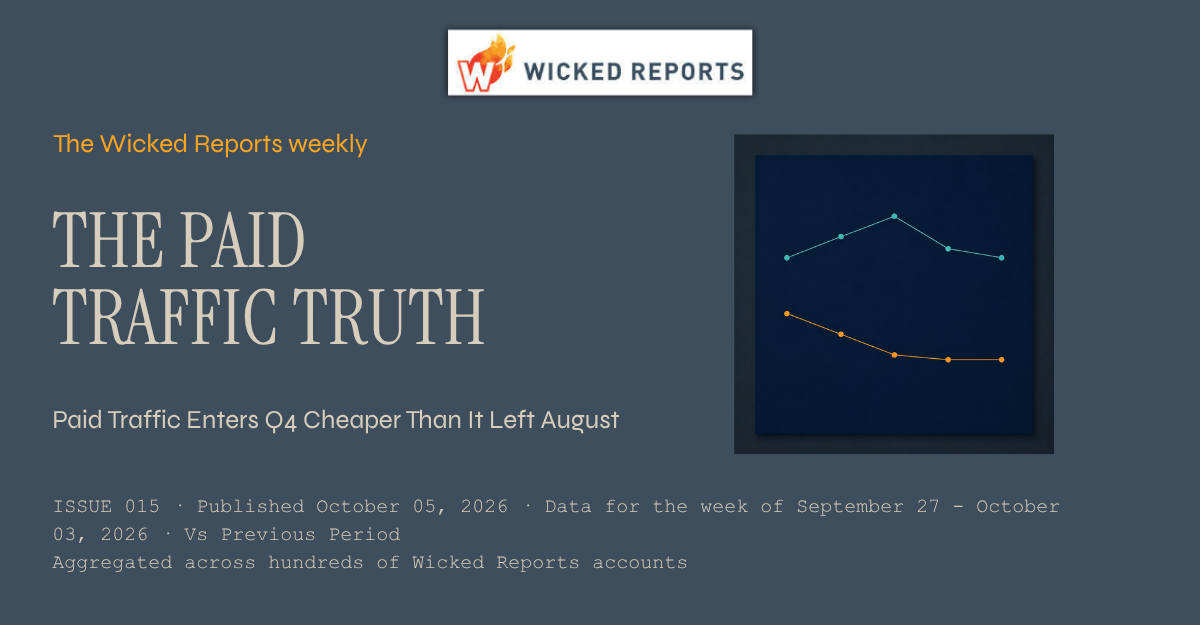
The Paid Traffic Truth — Issue 015
Published October 05,2026 * Data for the week of September 27 to October 03 2026 * Aggregated across hundreds of Wicked Reports accounts.
Paid Traffic Enters Q4 Cheaper Than It Left August
September threw a holiday spike, a month-long Meta slide, and a YouTube reset at the market. Now the month is closed and the noise has washed out, and the net result is simple: the two channels carrying 92% of tracked spend enter Q4 at or below where they ended August. These are the baseline numbers to judge the Q4 ramp against, and the ramp is the next thing coming.
This week's number
The September round trip is complete. Meta enters October at $76, 11% cheaper than late August. Google enters at $160, flat to where it started, with the holiday spike fully unwound.
01 / Introduction
The month closed. Here is where it left you.
This is the first issue of October, so before the weekly grids, this one does something the series has not done before: it closes out a full month. Five weeks of verified data covered the Labor Day run-up, the holiday itself, two clean recovery weeks, and now the first week of Q4 proper. Every one of those weeks moved some channel around. The question that matters for planning is what survived the round trip.
The answer is below, followed by the same four verified grids as every week: new customer acquisition, first click versus last click, overall channel performance, and new customer lifetime value. All first-party, order-verified data aggregated across hundreds of Wicked Reports accounts. No modeling, no surveys.
02 / Analysis
One chart, the whole month
Here is September in a single picture: verified nCAC for the two largest channels, all five weeks.
Two stories ran through September, and they ended differently. Google's story was the holiday: Labor Day pushed its new customer cost from $161 to $179, and three consecutive declining weeks brought it back to $160, with conversion up 3% this week. A complete round trip. If you panicked about Google in mid September or celebrated it this week, you were reacting to the calendar both times.
Meta's story was not the holiday, and that is the part worth carrying into Q4. Its decline ran through the holiday weeks and the clean weeks alike, $85 to $74 over four weeks, before ticking up 2% to $76 this week on softer conversion. One week is a data point, not a reversal, so the honest read is that the slide has stopped and the channel has settled at a level about 11% below late August. The quality held the entire time: 91% of Meta's tracked customers are verified first-time buyers, same as every week this month, with the markup over blended CAC now at 9%. The cause of the slide is still what it was last week, a mix story rather than cheaper auctions, and still unproven. The level itself is verified either way.
Why this matters right now: the Q4 ramp is the next structural event on the calendar. As BFCM spend floods the auctions over the coming weeks, costs will climb, and every brand will face the same question at every weekly check-in: is this seasonal inflation I planned for, or is my account deteriorating? You cannot answer that without knowing precisely where you started. This month-end snapshot is the market's starting line. Yours is in your own account.
03 / New Customer Acquisition
The full acquisition picture, by channel
Beyond the two headliners: Microsoft drifted up again to $191 and has now round-tripped the holiday in the wrong direction, the one major channel entering October more expensive than it entered September. YouTube settled a second week in the low $400s, still well below its August range, with a soft conversion week. TikTok collapsed back to thin-data status with a new-buyer share that fell to 51%, its fourth violent swing in four weeks, which is exactly why thin channels never anchor a conclusion here.
04 / First Click vs Last Click
Who starts the sale vs who takes the bow
This grid is a measurement reconciliation, not an investment case. It explains why the platforms' own dashboards disagreed with the verified numbers all month: last click shifts credit from the channels that open journeys toward the channels that close them, so a last-click view understated Meta's September and flattered the search channels. When you compare your Q4 numbers against a baseline, make sure both were measured under the same model, or the comparison is meaningless before you start.
05 / Overall Channel Performance
Where the money goes, and THE TRUE COST OF A NEW CUSTOMER
The standing pattern survives the month-end accounting intact. Google's ROAS is 2.7x Meta's, and a new customer still costs 111% more there, because its 54% markup between blended CAC and true new customer cost is repeat demand doing the flattering. Meta's 9% markup is the tightest in the grid. Whatever the Q4 auctions do to these numbers, the ROAS column will keep ranking the channels in the wrong order for growth, and that does not change with the season.
06 / New Customer Lifetime Value
What a new customer becomes over a year
The value side barely moved all month, which is the point of this grid. Acquisition costs swung with the calendar while what a new customer becomes stayed steady: Meta's one-year value sat within a few dollars of $108 every week, Google's near $243. That stability is what makes the cost side plannable. Your Q4 question is not whether customers will be worth less, it is what you will pay to get them. The standing caveat applies: this grid blends brands at very different price points, so treat it as a directional market benchmark, not a promise for any one store.
07 / Conclusion
Write down your starting line this week
The market enters Q4 with Meta around $76 and 11% cheaper than late August, Google flat at $160, Microsoft slightly elevated, and YouTube settled well below its summer range. Clean entry conditions, about eight weeks out from BFCM, with the spend ramp ahead of it.
The move this week takes twenty minutes. Pull your own verified September numbers per channel, nCAC and new-buyer share, and write them down as your Q4 baseline before October data starts piling on top of them. Then judge every week of the ramp against that line. When your Meta nCAC reads 30% higher in early November, the baseline is what tells you whether that is the seasonal inflation everyone pays or a problem that is yours alone. Brands that skip this step spend November arguing about numbers nobody wrote down in October.
See your own version of these four grids.
Your real nCAC next to your aCAC, your first versus last click gap, your new customer LTV by channel, in your own account.
Get the Paid Traffic Truth Report directly to your inbox.
How this week's numbers were built. Aggregated across hundreds of Wicked Reports client accounts for the week of September 27 to October 03, 2026, except first click vs last click, which uses a rolling 90 day window. New versus repeat is verified at the order level against first party order IDs, not modeled and not surveyed. The new visit to new customer conversion rate credits the channel that originated the new visit. Channels without cost data, including email, SMS, organic, and influencer, are left out of the cost comparisons. Snapchat is excluded for negligible spend. Pinterest is marked with an asterisk because it ran on a small number of new customers this week, so it is not used to anchor any headline. The channel labeled Facebook in the underlying platform data is shown here as Meta. Charts and tables carry meaning through direction, labels, and contrast rather than color alone.
Topics: Wicked Reports New Customer Acquisition Cost (NCAC) Meta Ads Paid Traffic Truth paid media measurement BFCM Q4 Budget Planning
3 min read
The $55 nCAC drop Meta never showed you
New customer acquisition cost is supposed to be a number you can trust the day you read it. In Q4 it is not, and the size of the gap is the whole story.