
Wicked Repots Case Study:
Tier 11 + Pet Ecommerce Brand

How Tier 11 cut nCAC 34% and grew new customers 25% — on 2.7% more spend — by fixing what the scoreboard was actually measuring.


At a glance
![]()
“In-platform attribution will always undercount top-of-funnel. The metric that matters is new customer creation — and Wicked gives us the truth on that.”
 Tier 11 Media Team
Performance Agency
The Brand & The Agency


Brand
Pet Ecommerce Brand
A direct-to-consumer pet brand with a premium, technology-driven product. Sold through their DTC site, Amazon, and select retail partners. A premium price point means every new customer acquisition dollar has to count.

Agency
Tier 11
A performance marketing agency specializing in full-funnel growth for DTC brands. Their methodology — the Conversion Engine — integrates creative, traffic, landing page, and data & analytics into a single operating rhythm.
Tier 11 runs campaigns across Meta, YouTube, Google, Bing, TikTok, Amazon, and native advertising platforms.
The Challenge:
Five Months of Missed Forecasts
![]()
From June through October 2025, the brand missed unit targets every single month while spend climbed. The platform dashboards showed activity. The business wasn't growing. Something was wrong at the measurement layer — they just didn't know what.

5 Missed Forecasts in a Row
From June through October 2025, unit targets were missed every single month while ad spend kept climbing.
.svg)
nCAC at All-Time High ($193)
Budget was concentrated in bottom-of-funnel channels capturing demand instead of creating it.

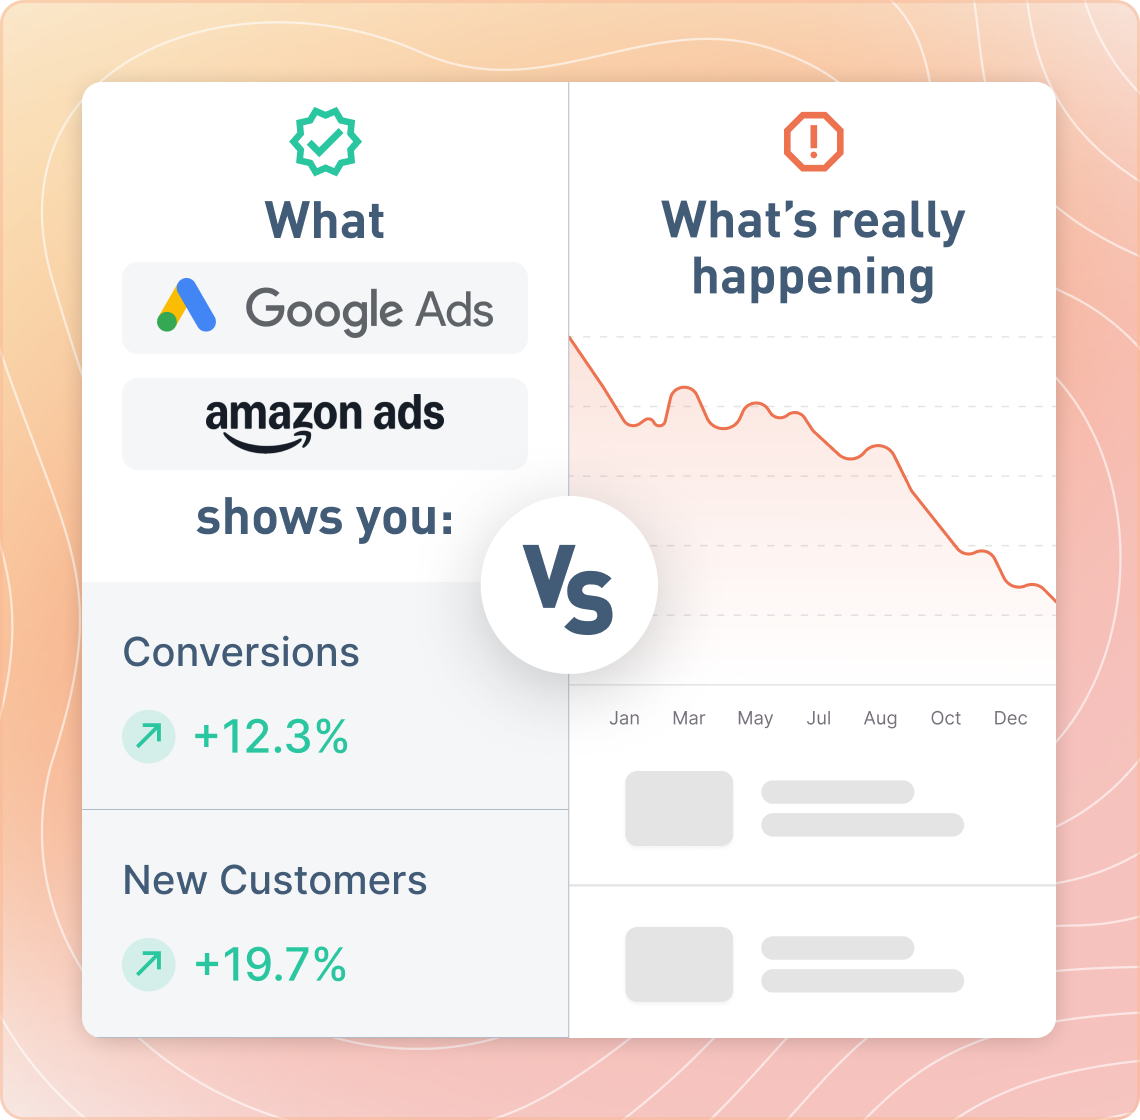
Attribution Hiding the Real Picture
Amazon and Google Brand looked productive. Both were taking credit for conversions driven by top-of-funnel activity they had nothing to do with.

The Retargeting Trap
Bottom-of-funnel channels were quietly consuming budget that should have been creating new customers. The scoreboard looked fine. The business was stalling.

The Root Cause:
Wrong Scoreboard, Wrong Channels
![]()
The team was optimizing toward the wrong signals. Bottom-of-funnel channels — Amazon Brand, Google Brand — were consuming budget and claiming credit for conversions they didn't create. Top-of-funnel campaigns were being starved.
The fix wasn't a new creative strategy. It was getting the measurement right first.
The Strategic Shift:
Measure Correctly, Then Decide
Tier 11 implemented a three-part shift through their Conversion Engine methodology — but every decision was anchored to a single question: what does Wicked Reports show about new customer creation?
Step 1
Incrementality Testing to Surface Attribution Lies
Before moving a single dollar, the team ran controlled experiments to prove which channels were actually driving new customers vs. taking credit for conversions created elsewhere.
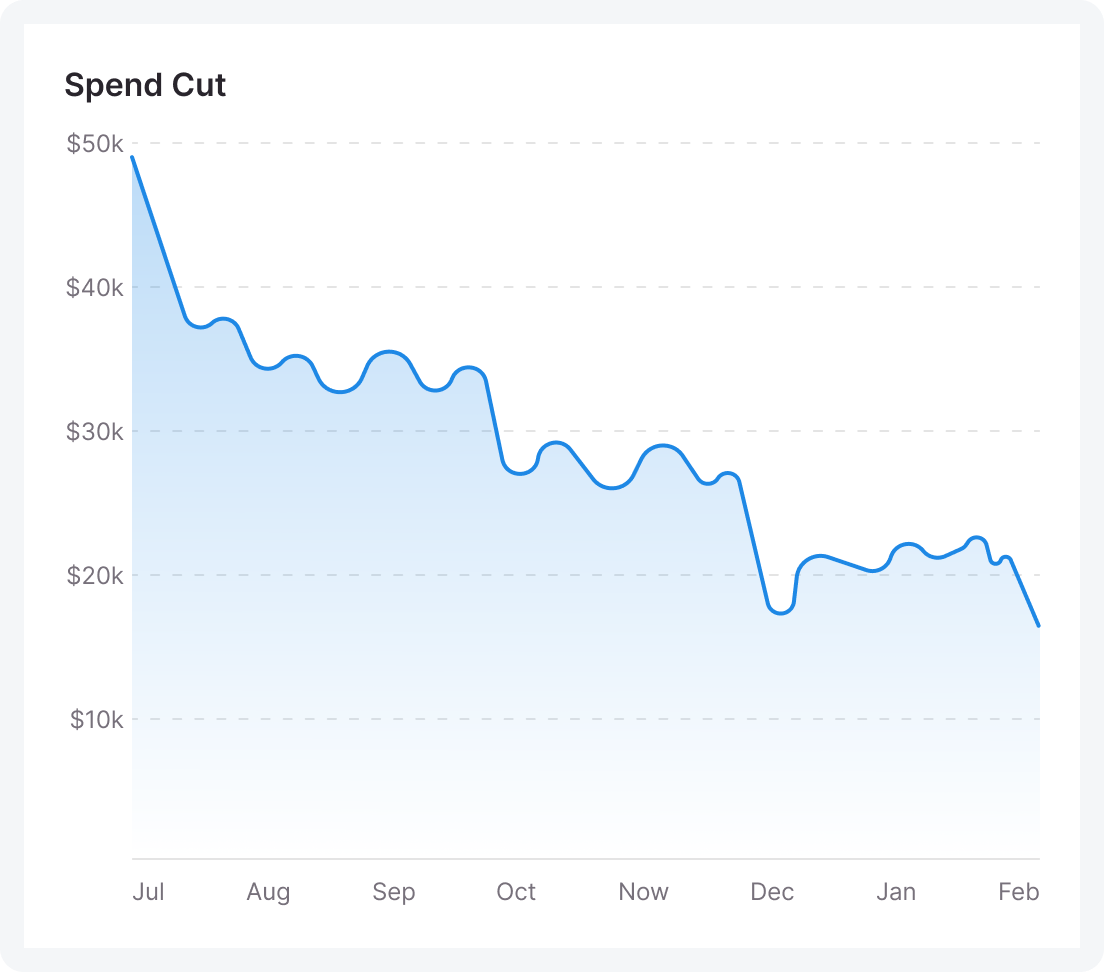
Amazon spend was cut 50%. Then 50% again. Then 50% again. Four consecutive cuts. Total reduction: 91% — from $52,500/month to $4,700/month. New customer units held steady at approximately 500/month. Revenue from Amazon increased 33%.
Google Brand was cut 95% over four months ($44,600 to $2,300). Clicks dropped only 17%. The brand had been paying a premium to appear for searches that would have found them organically anyway.
The data was clear: Wicked confirmed it. Both channels were Attribution Lies — channels that look productive because they harvest demand created elsewhere.
Step 2
Reallocate to Demand Creation
Budget freed from Amazon and Google Brand flowed to channels with a proven job: creating new customers who have never heard of the brand.
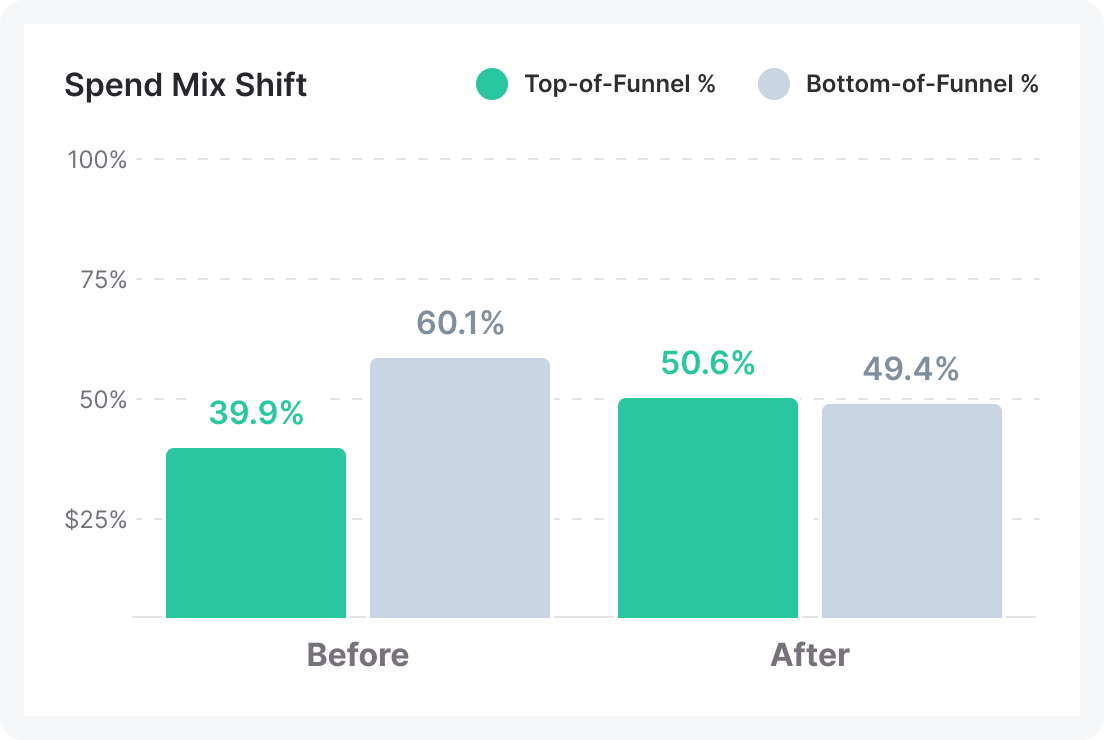
- Top-of-funnel share grew from 39.9% to 50.6% of total spend
- Meta and YouTube received additional investment
- Taboola native ads launched November 1 — driving 80–87% new visit rates across all advertorial campaigns
Native ads consistently delivered the highest new-visitor percentage of any channel — a direct measure of true top-of-funnel reach.
Step 3
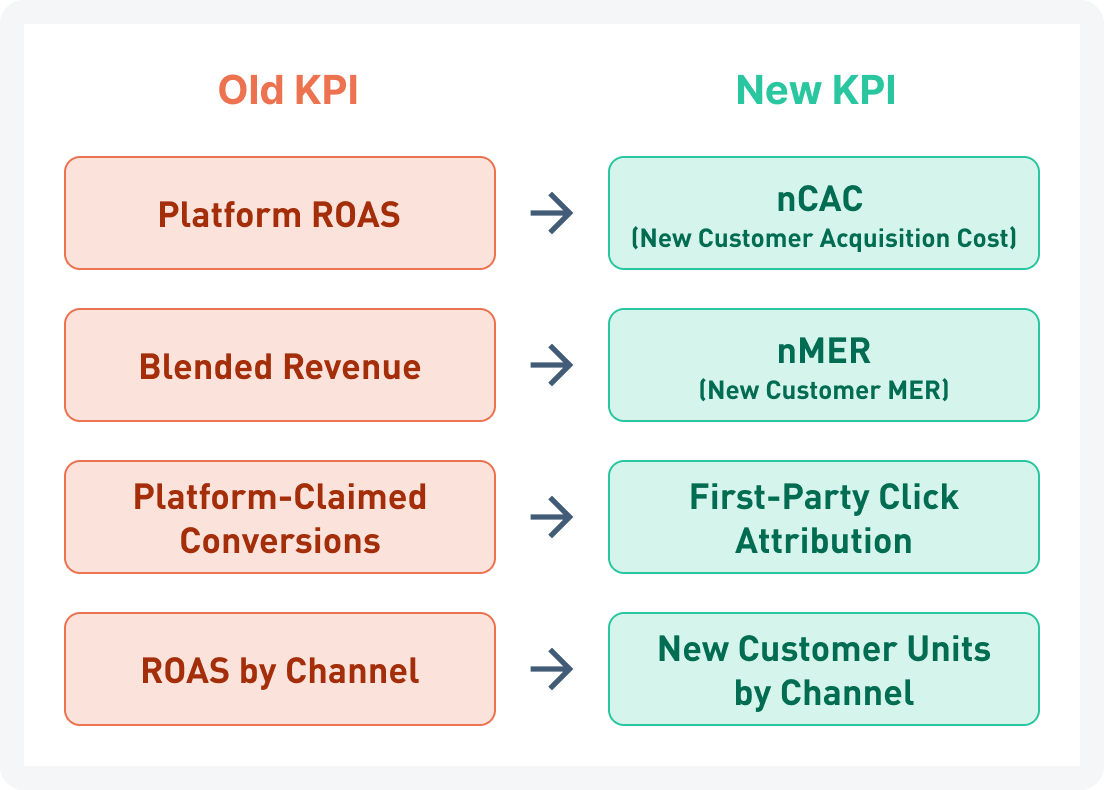
Track nCAC and nMER, Not Platform ROAS
The team replaced in-platform ROAS as the primary KPI. Platform reporting will always undercount top-of-funnel. It's structurally incapable of crediting channels that create customers weeks before those customers convert.
Instead: nCAC and New Customer Media Efficiency Ratio (nMER) became the north star metrics. These are first-party numbers from Wicked Reports — not modeled, not view-through-inflated, not subject to platform incentives.
If the nCAC is dropping and new customers are growing, the system is working. That's the scoreboard.
Results:
34% nCAC Drop on Nearly Flat Spend
![]()
From the November 1 turning point through February 2026 — four consecutive months, including the historically slowest months of the year for this brand. The historically slow December and January months saw nCAC hit an all-time low of $128 — down from a peak of $193. That's not a seasonal tailwind. That's a measurement correction producing real budget efficiency.
The Halo Effect: Channels That Grew Without Additional Spend

When top-of-funnel demand creation actually works, the whole funnel lifts. That’s exactly what happened:
- Organic revenue: +24% (zero additional ad spend)
- Email revenue: +13% (zero additional ad spend)
- Amazon revenue: +33% (on 66% less ad spend)

Google and Bing were restructured from approximately 20% non-brand to approximately 80% non-brand. January and February exceeded forecast by 20–30%.
Why It Worked:
The Correct Measurement Layer
Most attribution failures aren't creative failures. They're measurement failures. When you're graded on the wrong scoreboard with the wrong metrics in the wrong attribution windows, you make systematically wrong decisions — even when your instincts are right.
Tier 11 didn't just test new channels. They rebuilt the measurement layer first:

New Customer vs. Repeat Customer Clarity
Platform ROAS doesn't distinguish who bought. Wicked does. The team needed to see — at the campaign and channel level — exactly how many new customers each dollar was creating.

First-Party Attribution, Not Platform Claims
Real order IDs, real customer IDs, real click paths. Not modeled conversions. Not view-through credits. The team needed data they could defend.

The Correct KPI for Each Campaign's Intention
Top-of-funnel campaigns should not be judged by last-click ROAS. Wicked's 5 Forces framework assigns the right window, the right metric, and the right Scale/Chill/Kill zone before any budget decision is made.

nMER as North Star
The team moved off vanity metrics and onto New Customer Media Efficiency Ratio — a metric that blended CPU and new customer revenue into a single defensible KPI for exec-level reporting.
A Note on Native Advertising
Native advertising via Taboola was launched on November 1 as part of the demand creation push. The channel was measured correctly from day one — not by in-platform ROAS, but by new visitor creation efficiency (eCPNV: effective cost per new visitor).
What This Means for Your Brand
![]()
If this story sounds familiar, it's not a coincidence. The retargeting trap is one of the most common — and most expensive — misallocations in performance marketing today.
You Might Be In This Trap If...

Advertising for 12+ months with stable or growing spend
Blended ROAS looks acceptable on paper
Multi-touch human interactions
New customer growth has stalled or is declining
Monthly targets are consistently missed despite spending more
You're not sure which channels are actually creating demand
What the Data Is Likely Telling You
Your bottom-of-funnel channels are taking credit they didn’t earn
Your top-of-funnel is chronically underfunded
You're measuring the wrong thing — and making budget decisions accordingly
A measurement correction could unlock meaningful growth with nearly the same spend
The fix isn't a new creative angle or a new ad platform. The fix is a measurement system that separates new customers from repeat customers at the campaign level — so you can see exactly which channels are building your business and which ones are borrowing from it.
“A 2.7% increase in spend produced a 21.9% increase in revenue — because the first thing we fixed was what we were measuring.”
Tier 11 Media Team
Performance Agency
Want to Know What Your Attribution Is Actually Telling You?
Wicked Reports gives you:

First-party, click-based attribution — real order IDs, real customer IDs, not modeled estimates.

New vs. repeat customer segmentation at the campaign, ad set, and creative level.

Scale / Chill / Kill decision framework powered by the correct KPI for each campaign's intention.

Advanced Signal to send new-customer-specific conversion events back to Meta and Google — correcting platform optimization bias at the source.
↓ Book a live demo and see exactly where your current attribution is costing you money ↓
